

The following explains how to add, remove, and customize the reports and analytics metrics displayed on your dashboard, allowing you to monitor the information that matters most for your center.
- Navigate to the Dashboard. By default, it displays multiple report and analytics cards. Select the desired Date Range, then click Search to load the dashboard data.(Figure 1)
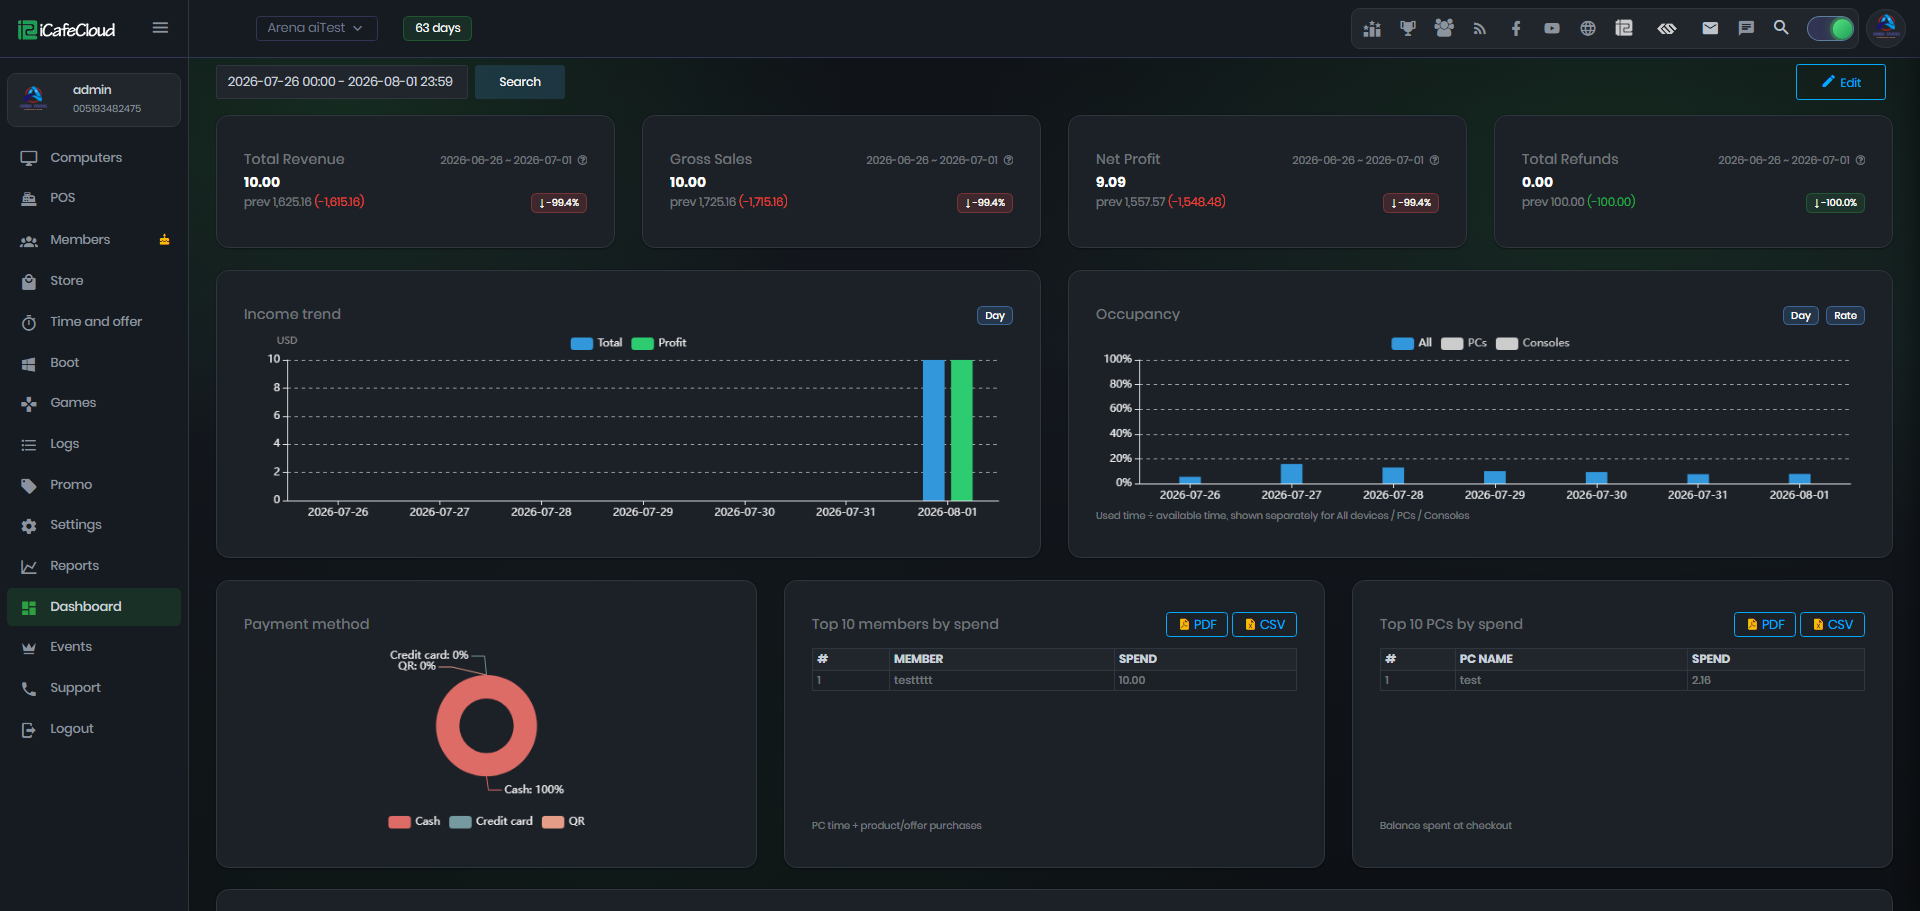
Figure 1
- The dashboard is fully customizable. Click the Edit button on the right side to open the customization menu, where you can add new cards, reset the layout to the default, cancel, or save your changes. (Figure 2)
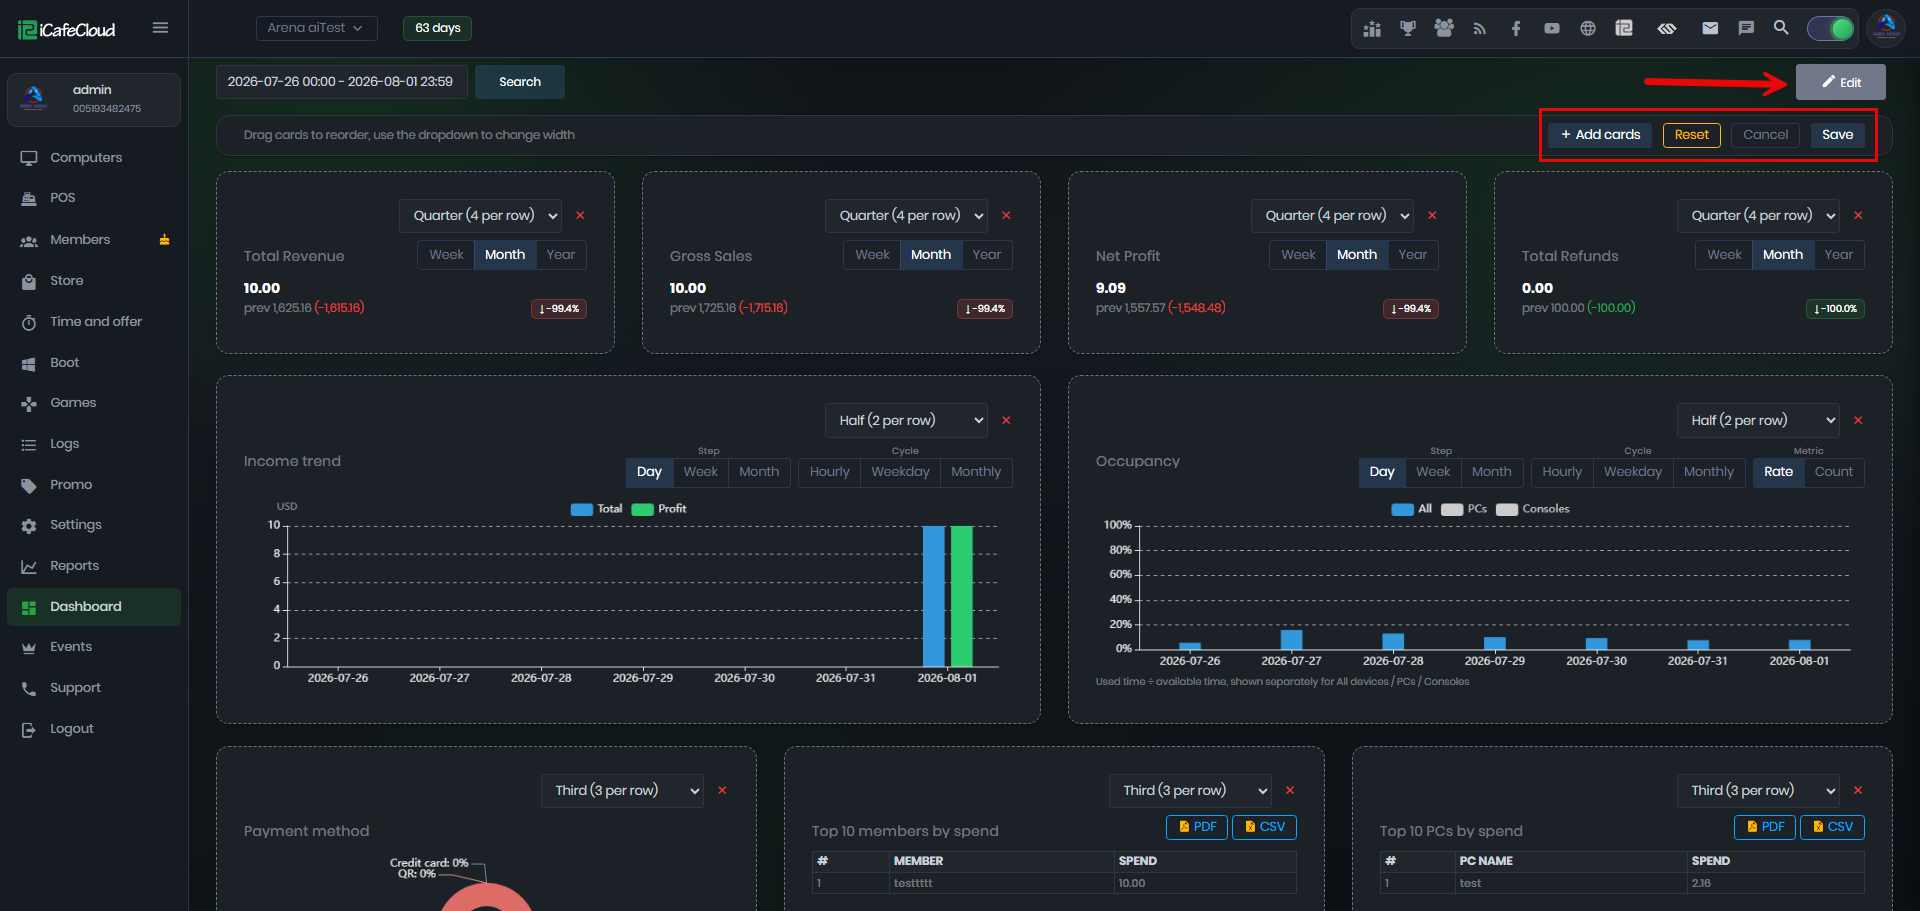
Figure 2
- You can also move the cards by drag and drop to change their positions (Figure 3)
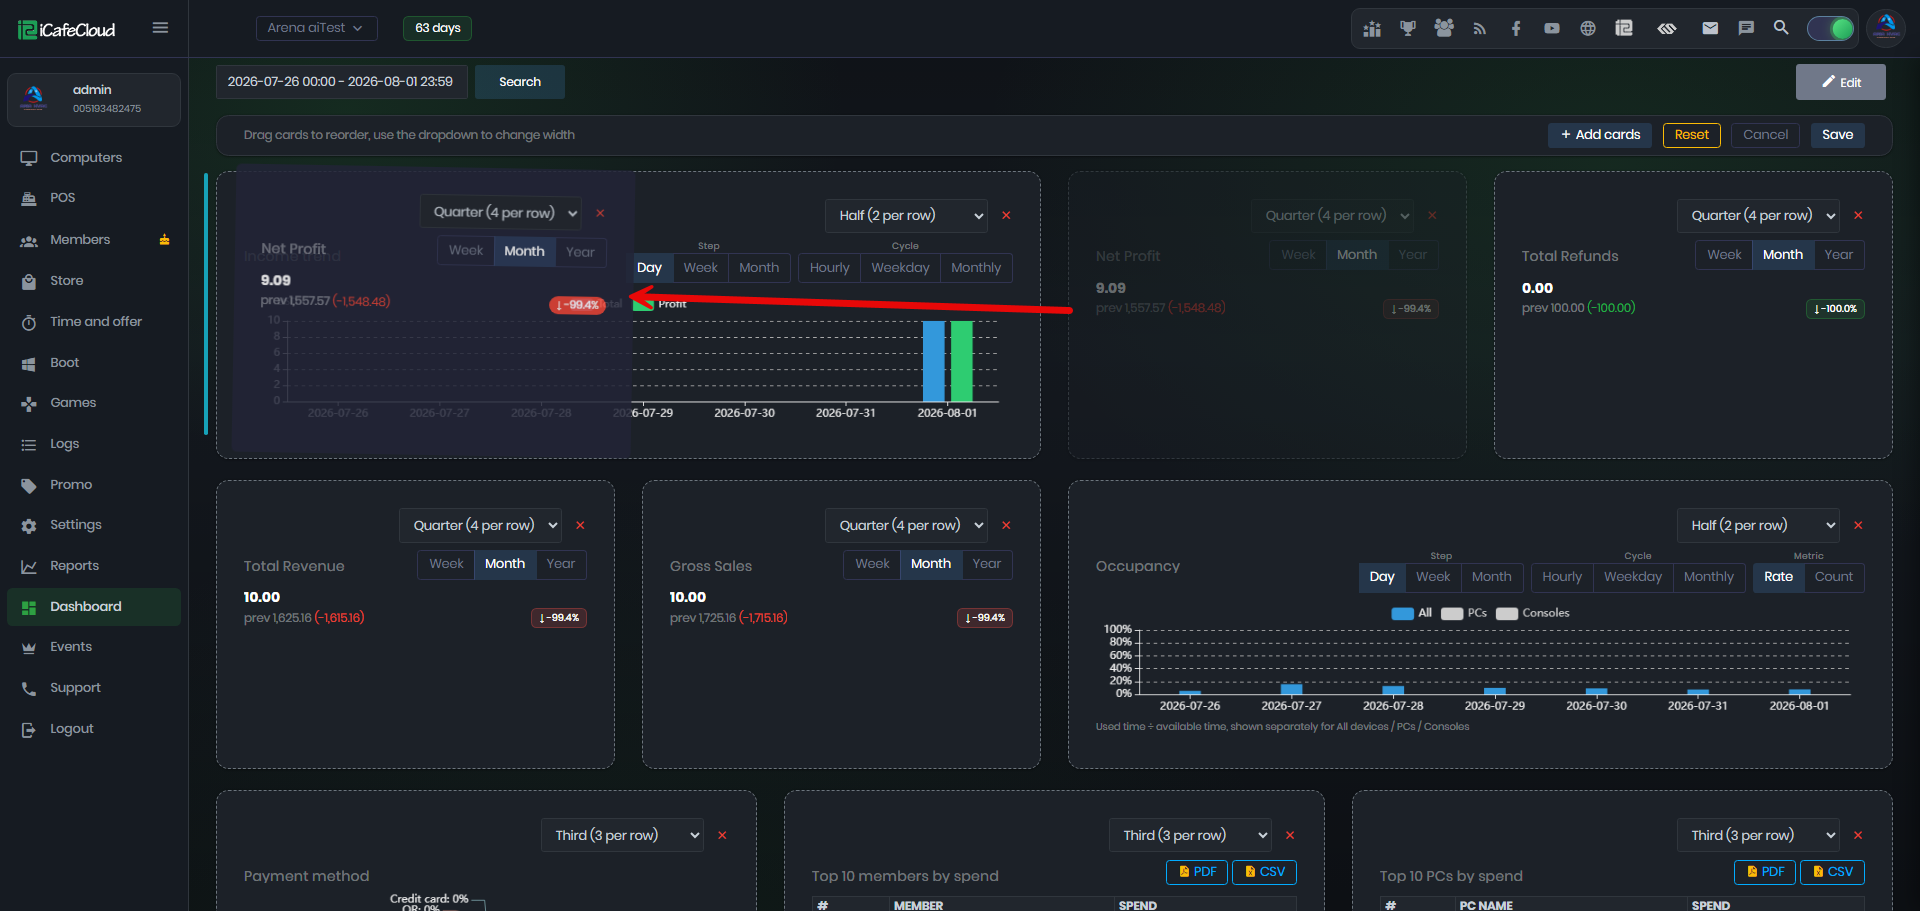
Figure 3
- You can also choose the width of each card in the dashboard layout. For example, Full Width displays one card across the entire row, while Quarter Width allows up to four cards to be displayed in the same row.(Figure 4)
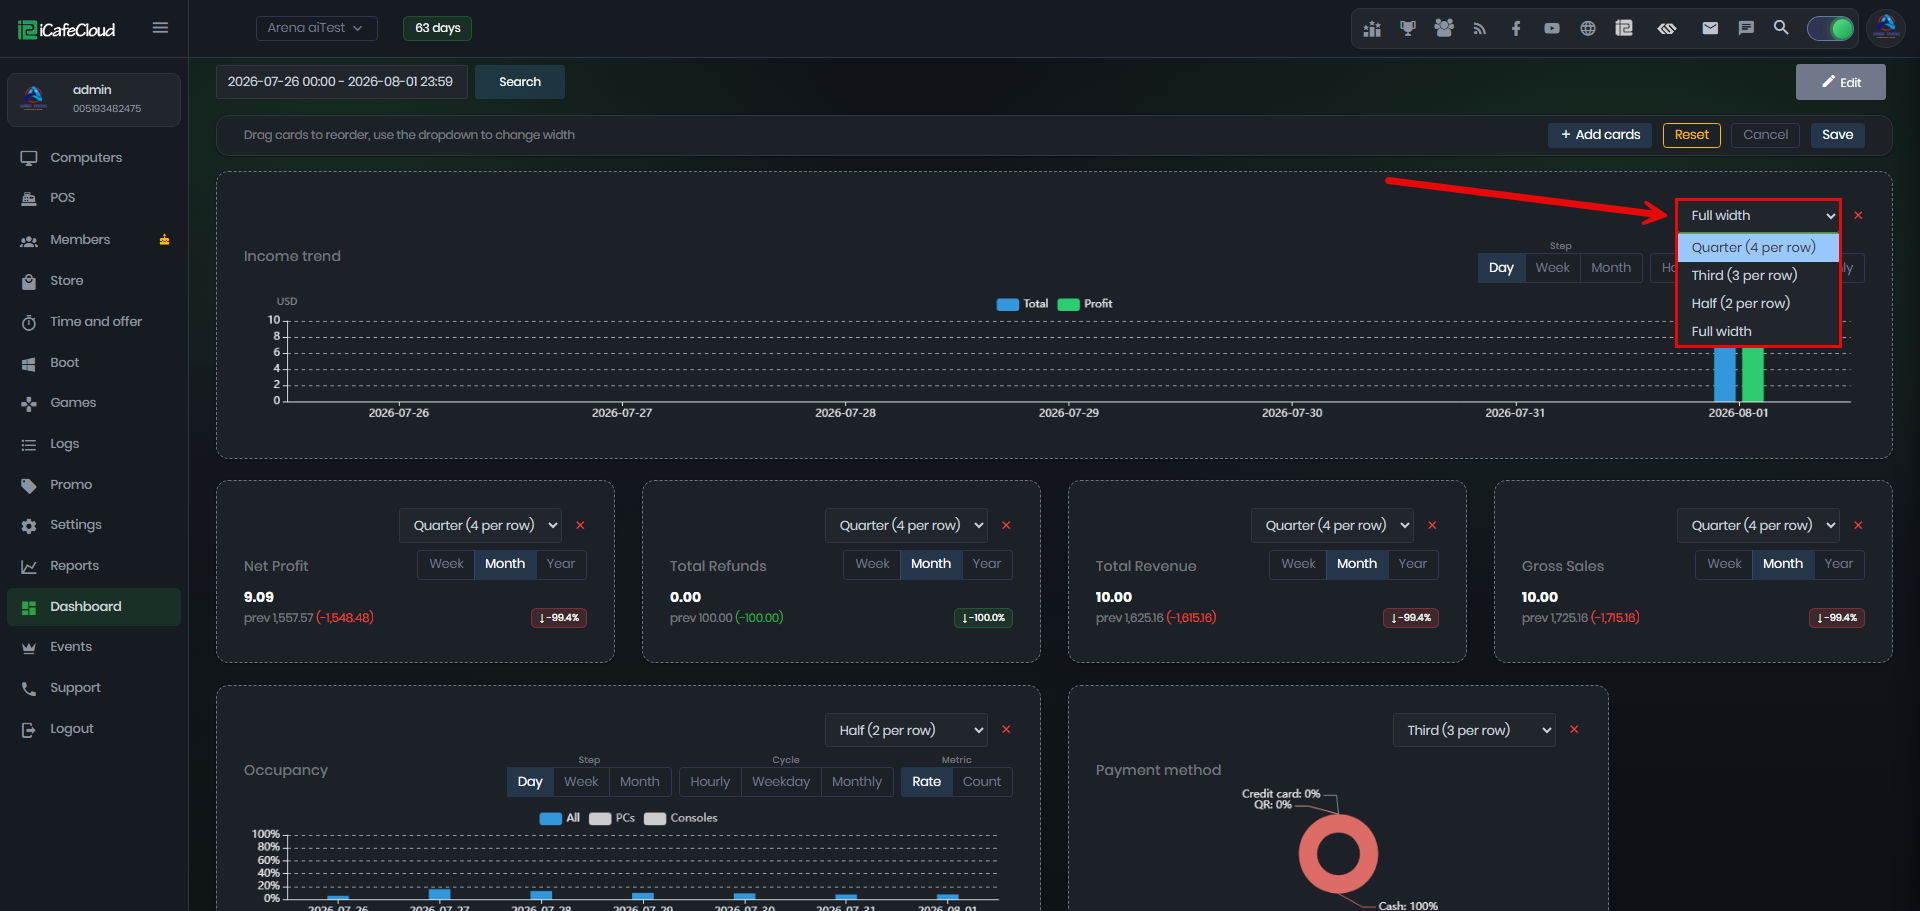
Figure 4
- You can add new cards from the available list, or quickly find them by searching by name or filtering by category. (Figure 5)
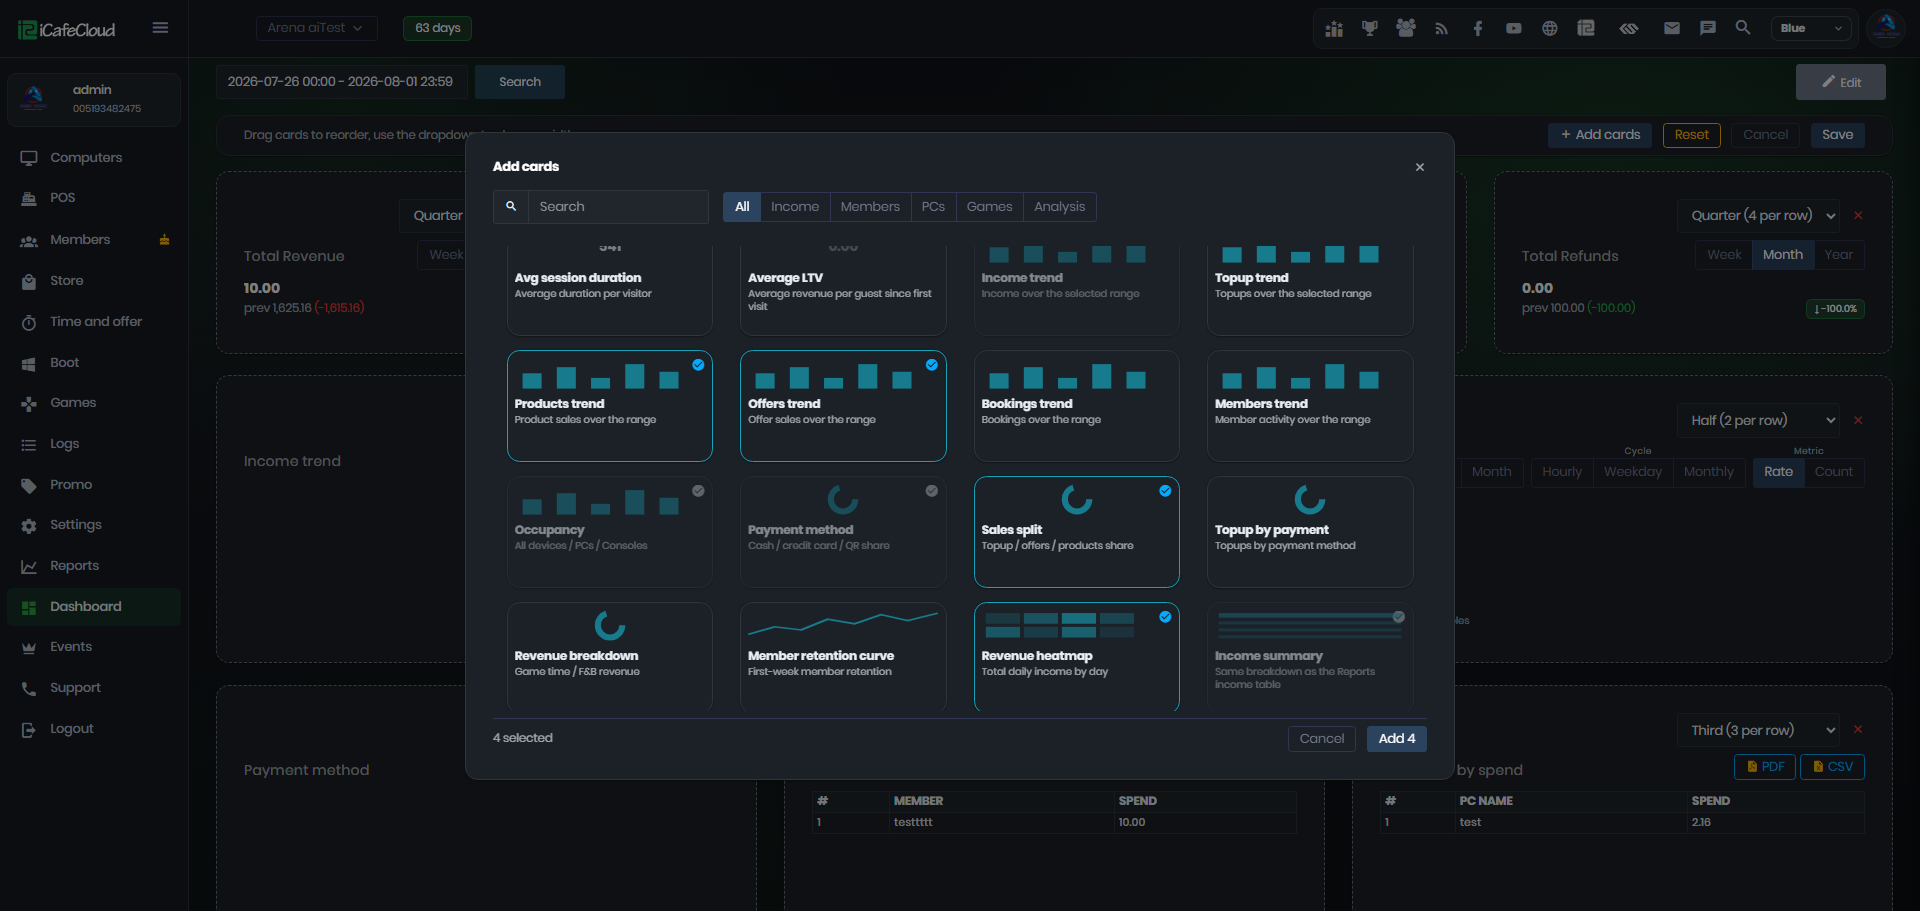
Figure 5