

The following explains the data available on the Games report.
- To open it, go to Reports - Games. The report is filtered by the selected date range, member group, and PC group, and is divided into two sub-tabs: Game Usage and Game License. (Figure 1)
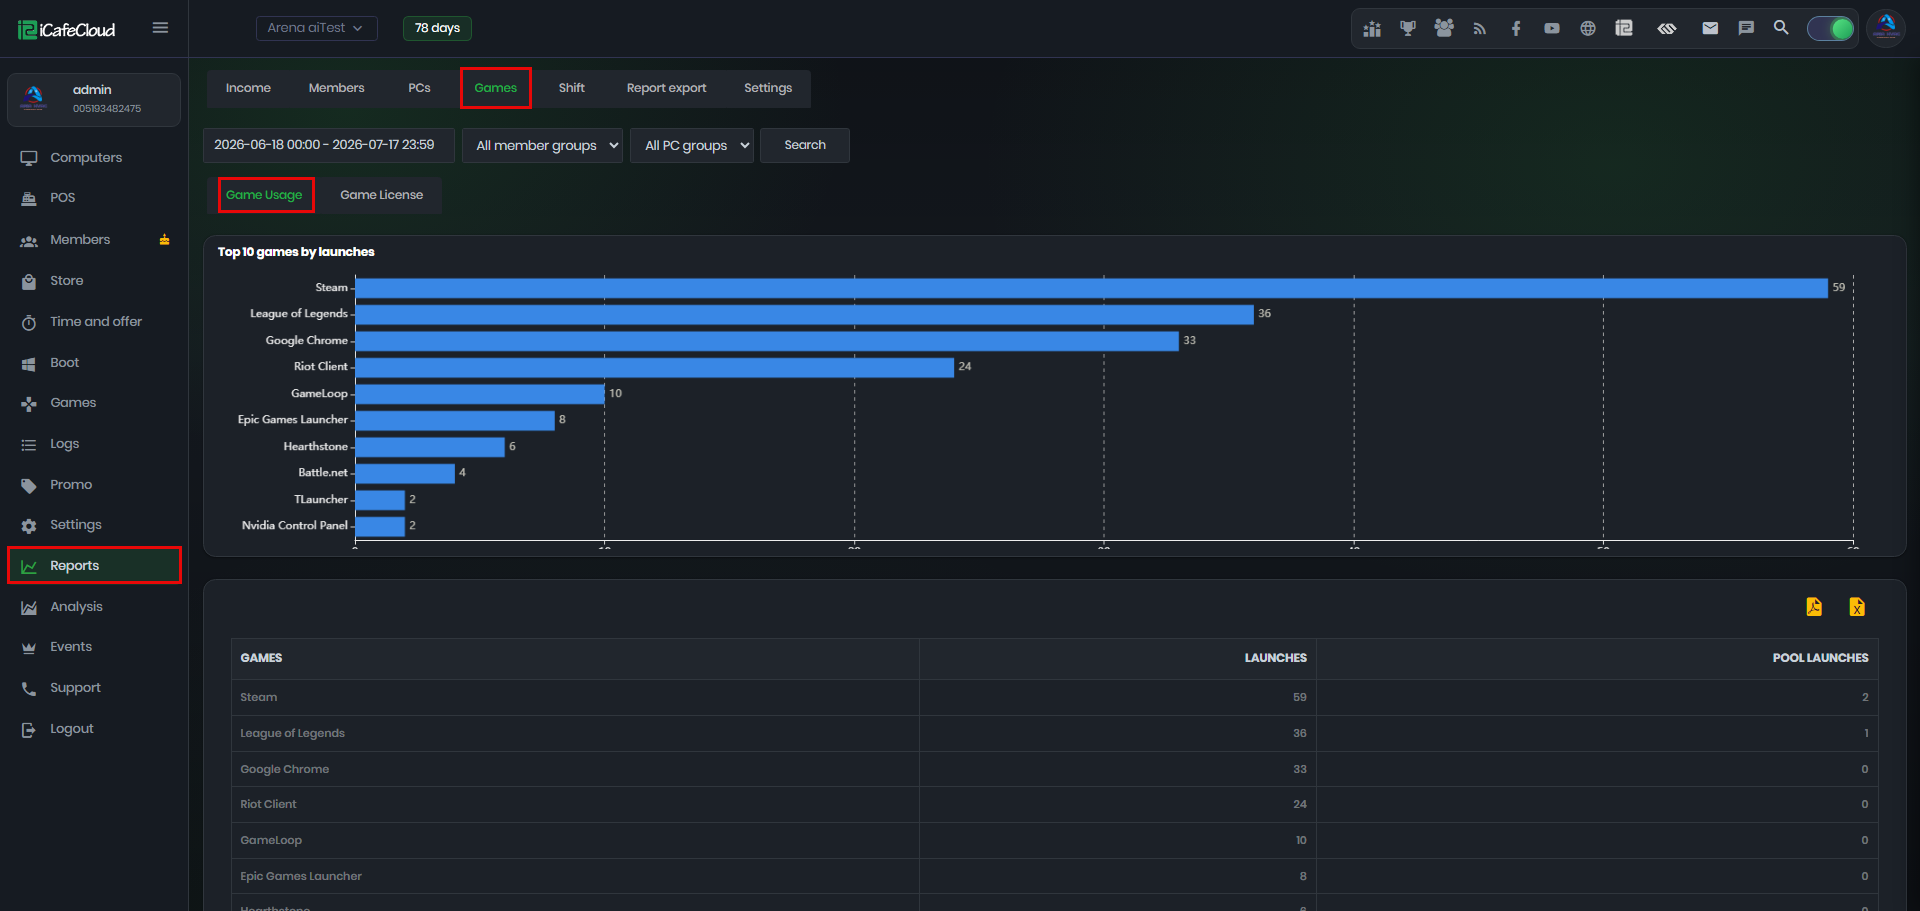
Figure 1
- Game Usage – Shows how often each game was played in the selected period:
Top 10 games by launches – A chart ranking the most launched games, so you can see at a glance what your customers play most. (Figure 2)
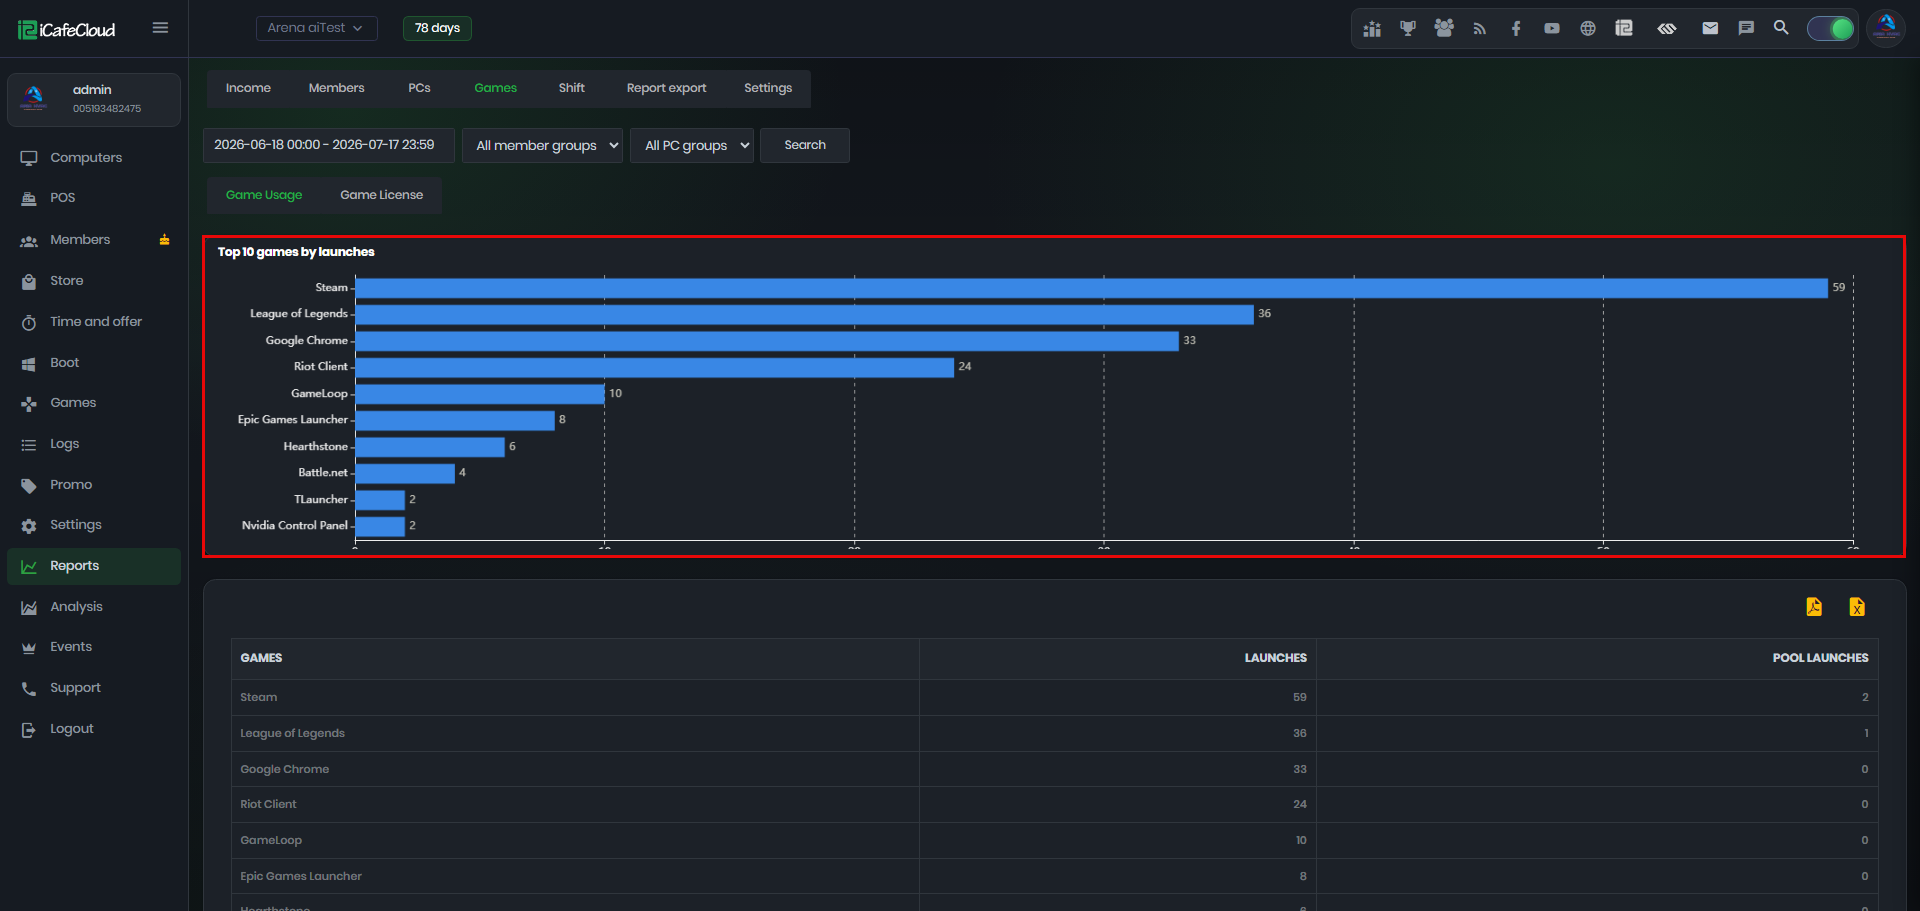
Figure 2
- The table below lists all games with: (Figure 3)
Launches = Number of times customers launched the game.
Pool Launches = Number of times the game was launched through the license pool function.
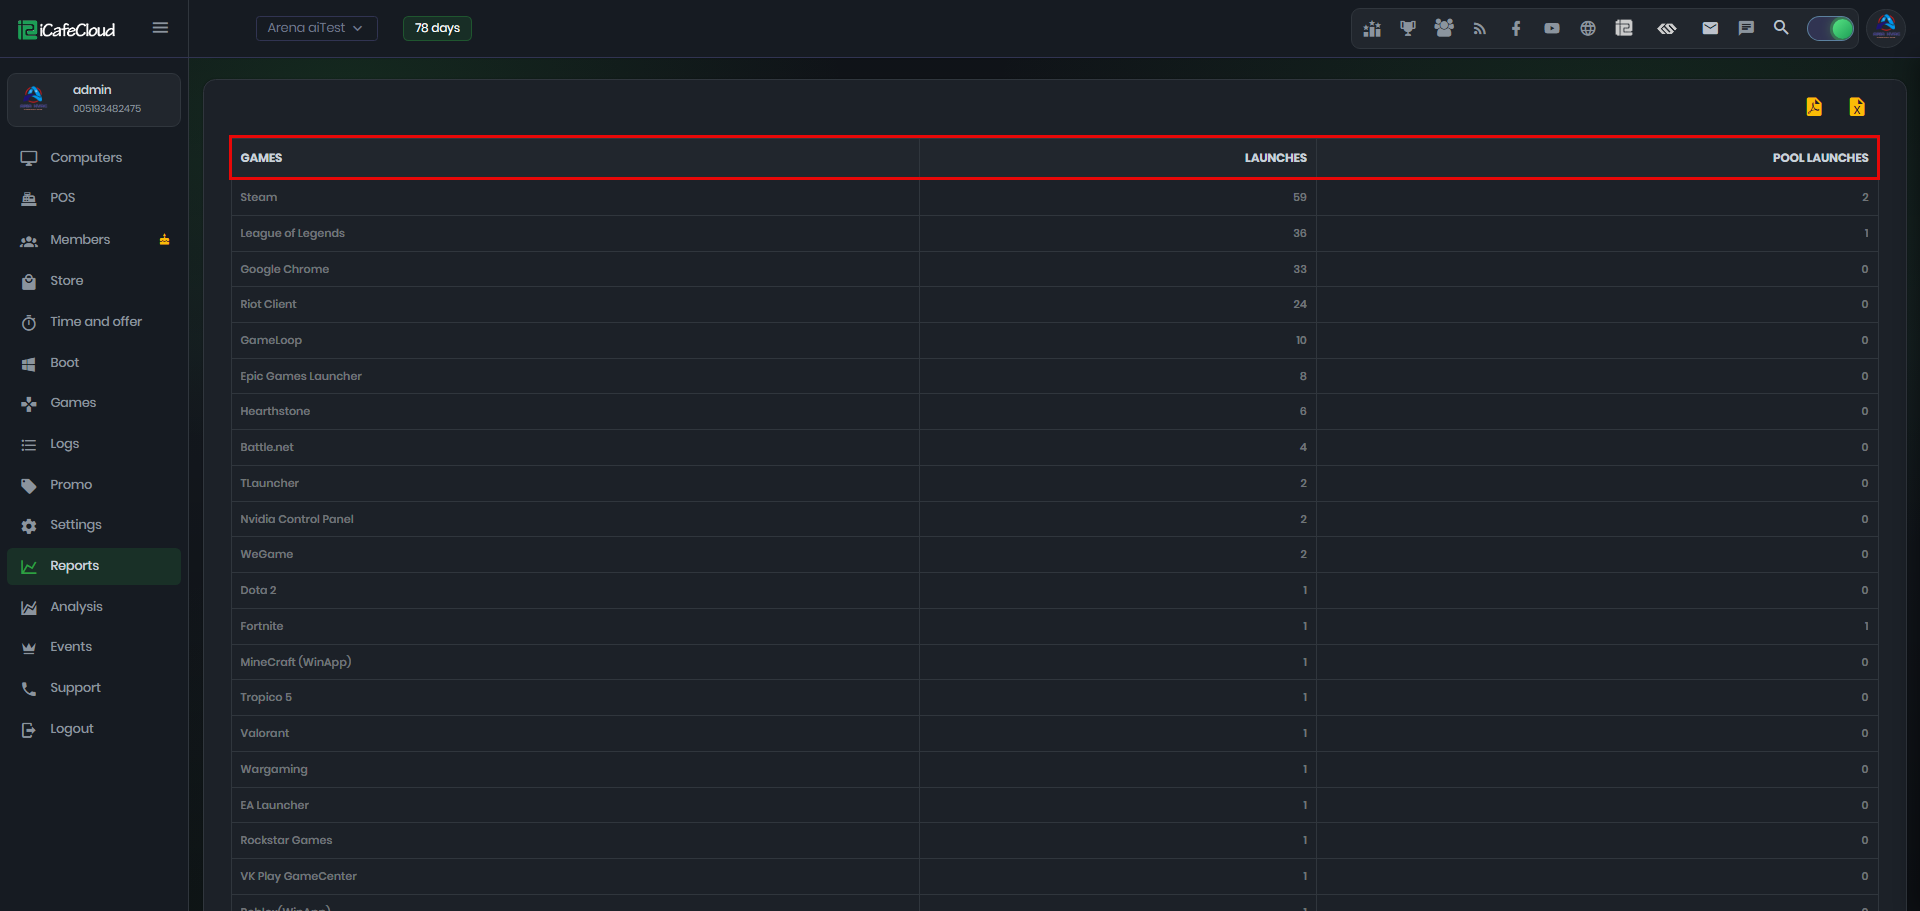
Figure 3
- Game License – Shows how the license pool was used per game: (Figure 4)
Request Count = Number of times a license was requested from the pool.
Shortage Count = Number of times a request could not be served because all licenses were in use. A high shortage count means you may need more licenses for that game.
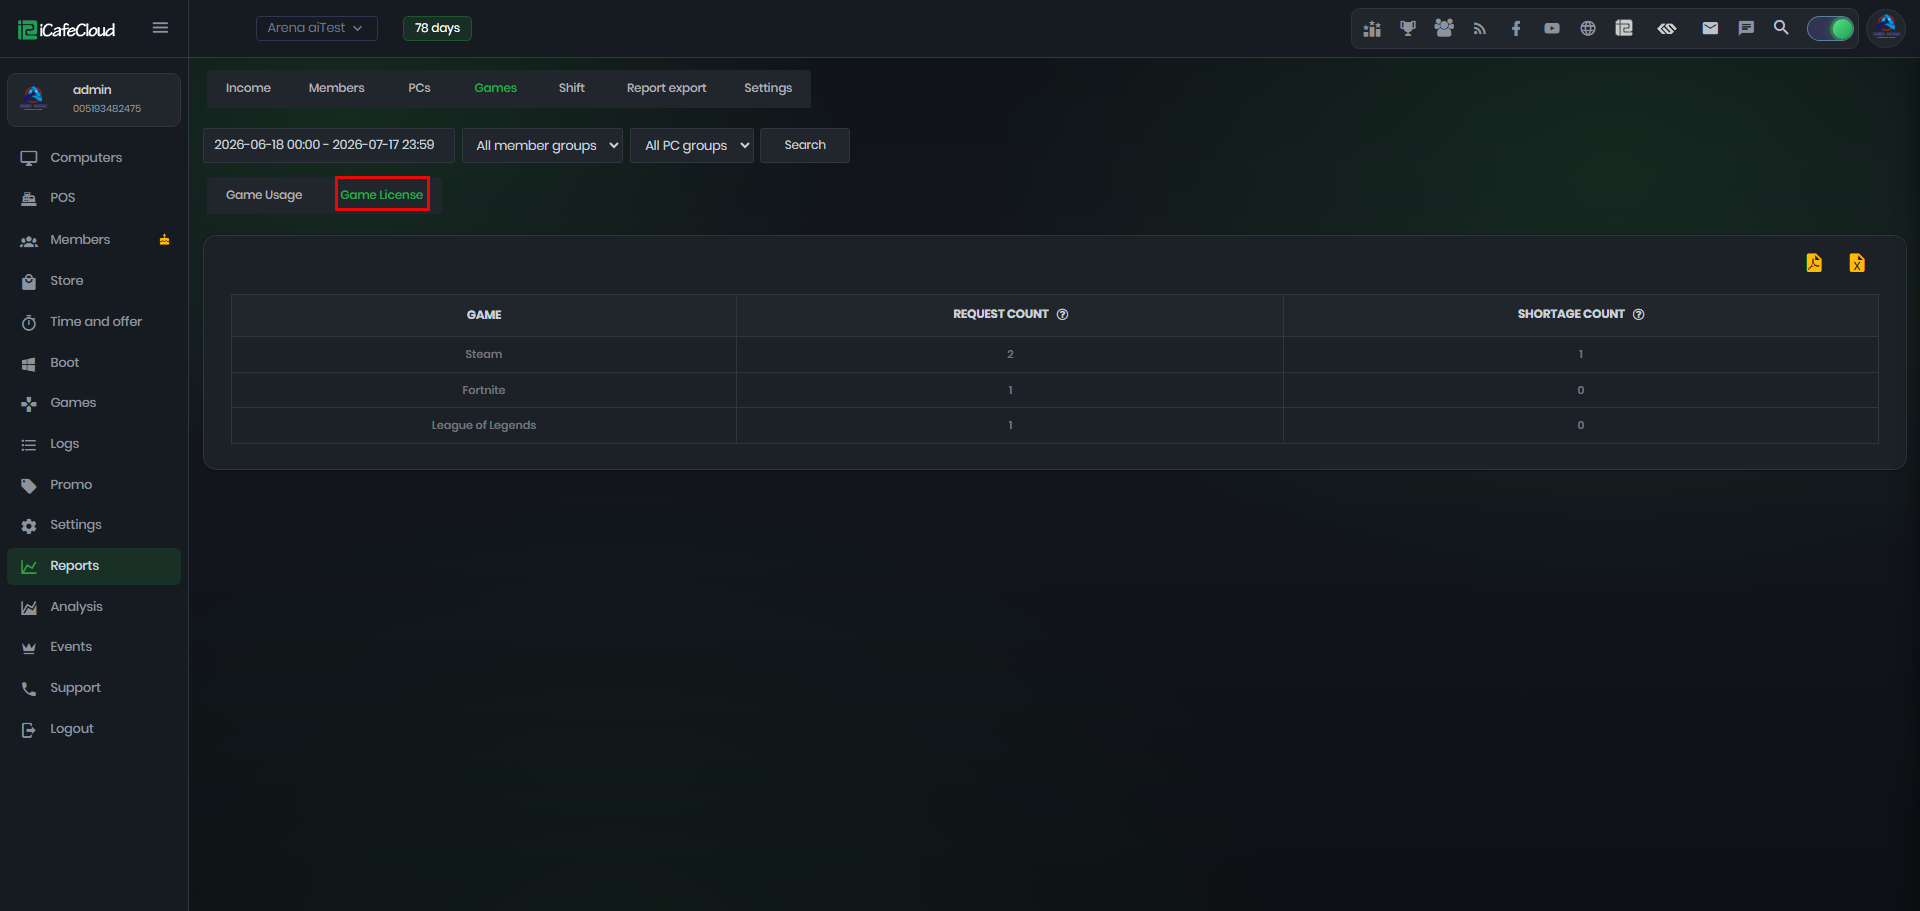
Figure 4
- Use the PDF and Excel buttons in the top-right corner of each table to download the report.