

The following explains the data available on the Members report.
- To open it, go to Reports > Members. The report is filtered by the selected date range, staff, member group, and PC group, and is divided into two sub-tabs: Members and User surveys. (Figure 1)
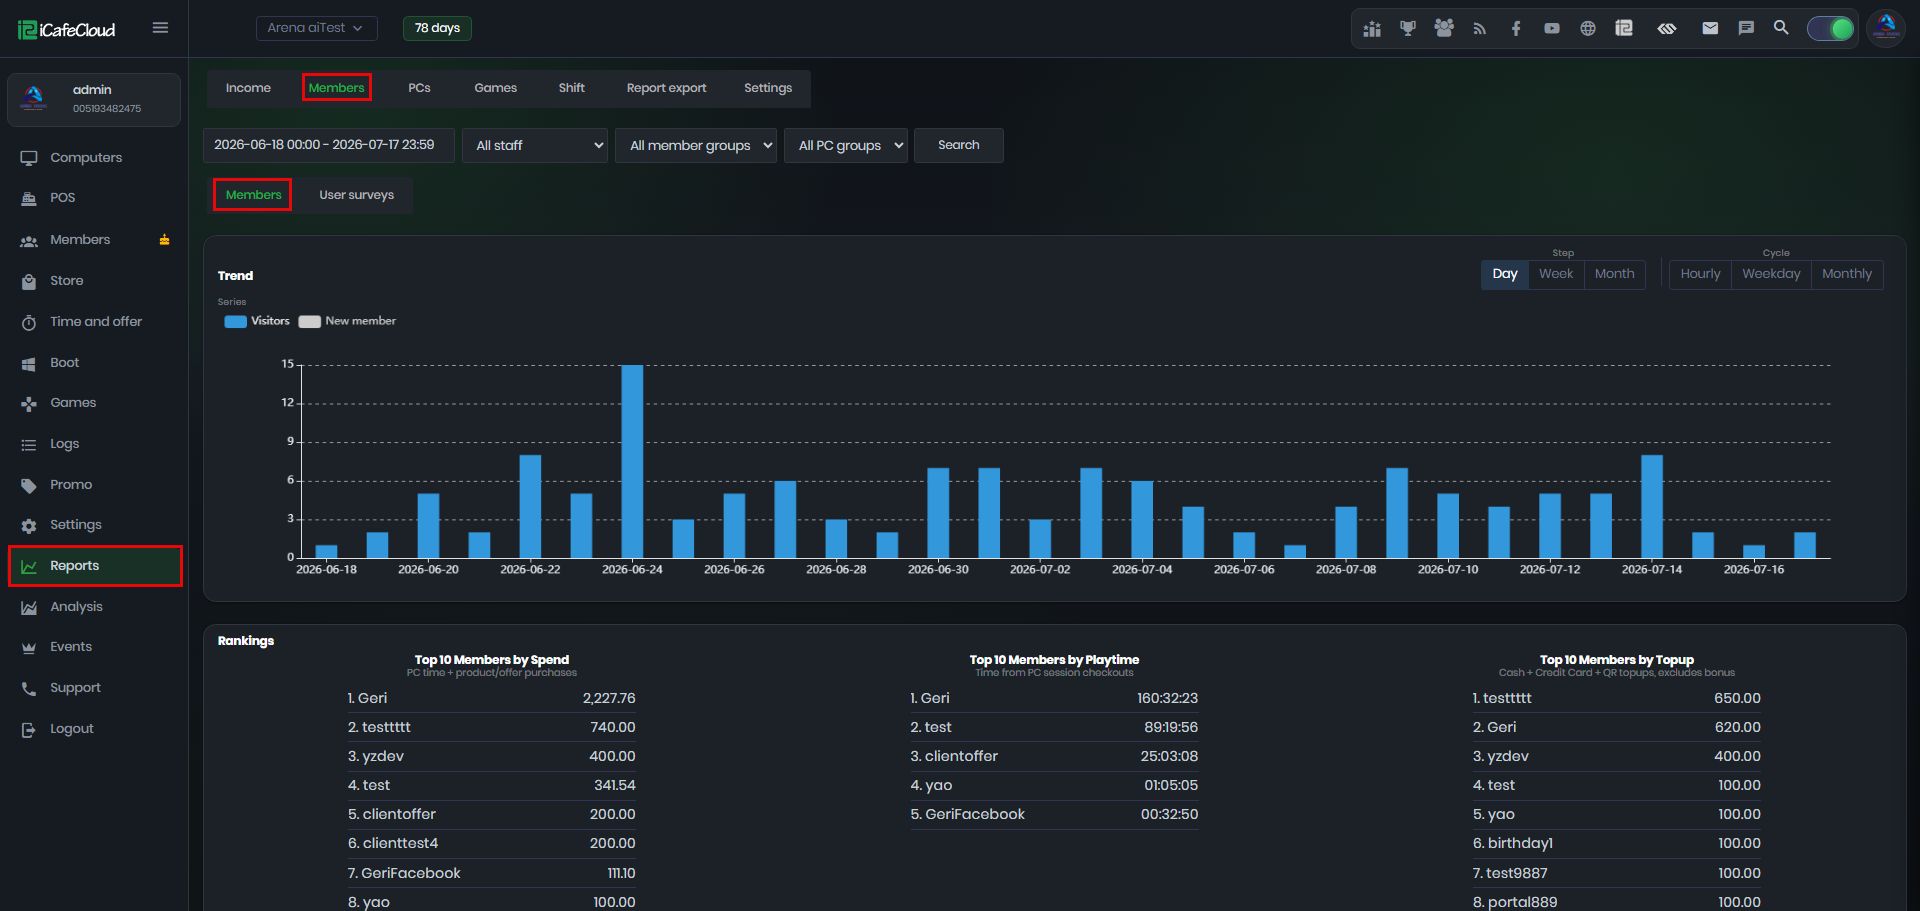
Figure 1
- Trend – Shows two series per period, click the legend to show or hide each one: (Figure 2)
Visitors – How many members visited the center.
New member – How many new members registered.
Step (Day / Week / Month) – Groups the data by calendar period.
Cycle (Hourly / Weekday / Monthly) – Groups it by recurring pattern, e.g. Hourly shows at which hours of the day members visit the most. Useful for planning staffing and promotions.
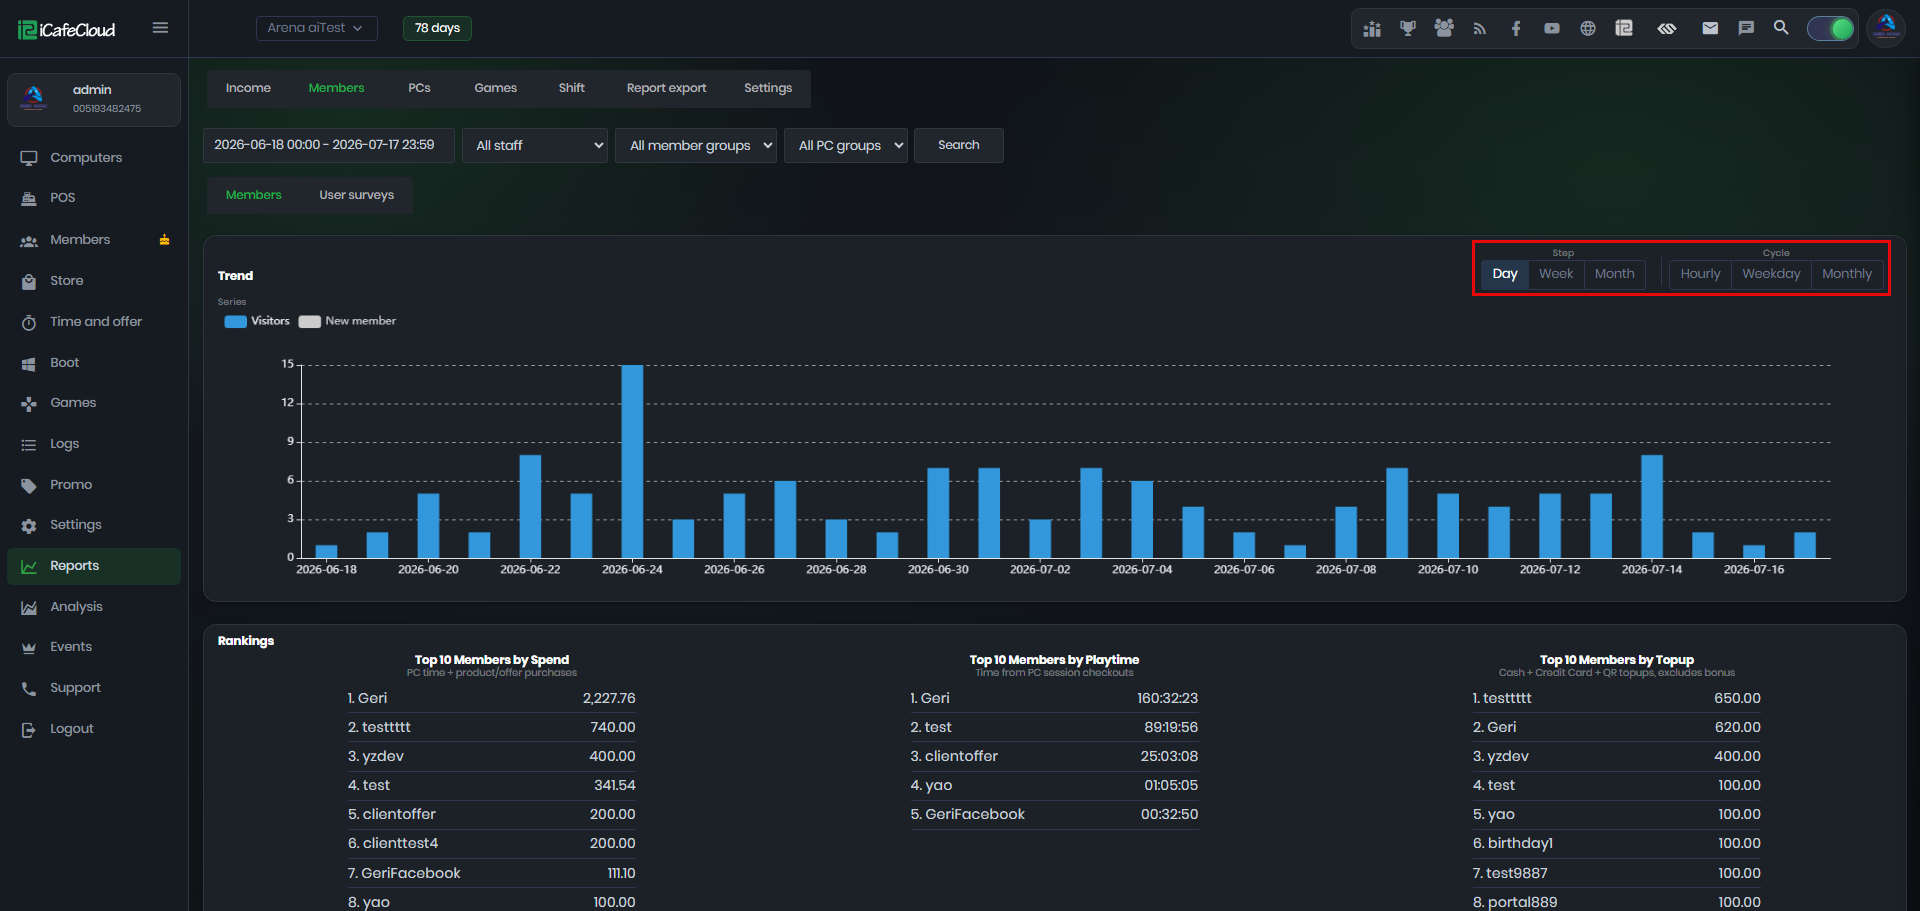
Figure 2
- Rankings – Three lists rank your members for the selected period: (Figure 3)
Top 10 Members by Spend – Spending on PC time plus product and offer purchases.
Top 10 Members by Playtime – Time from PC session checkouts.
Top 10 Members by Topup – Cash, Credit Card, and QR topups; excludes bonus credits.
Useful for identifying your most loyal customers, e.g. for rewards or promotions.
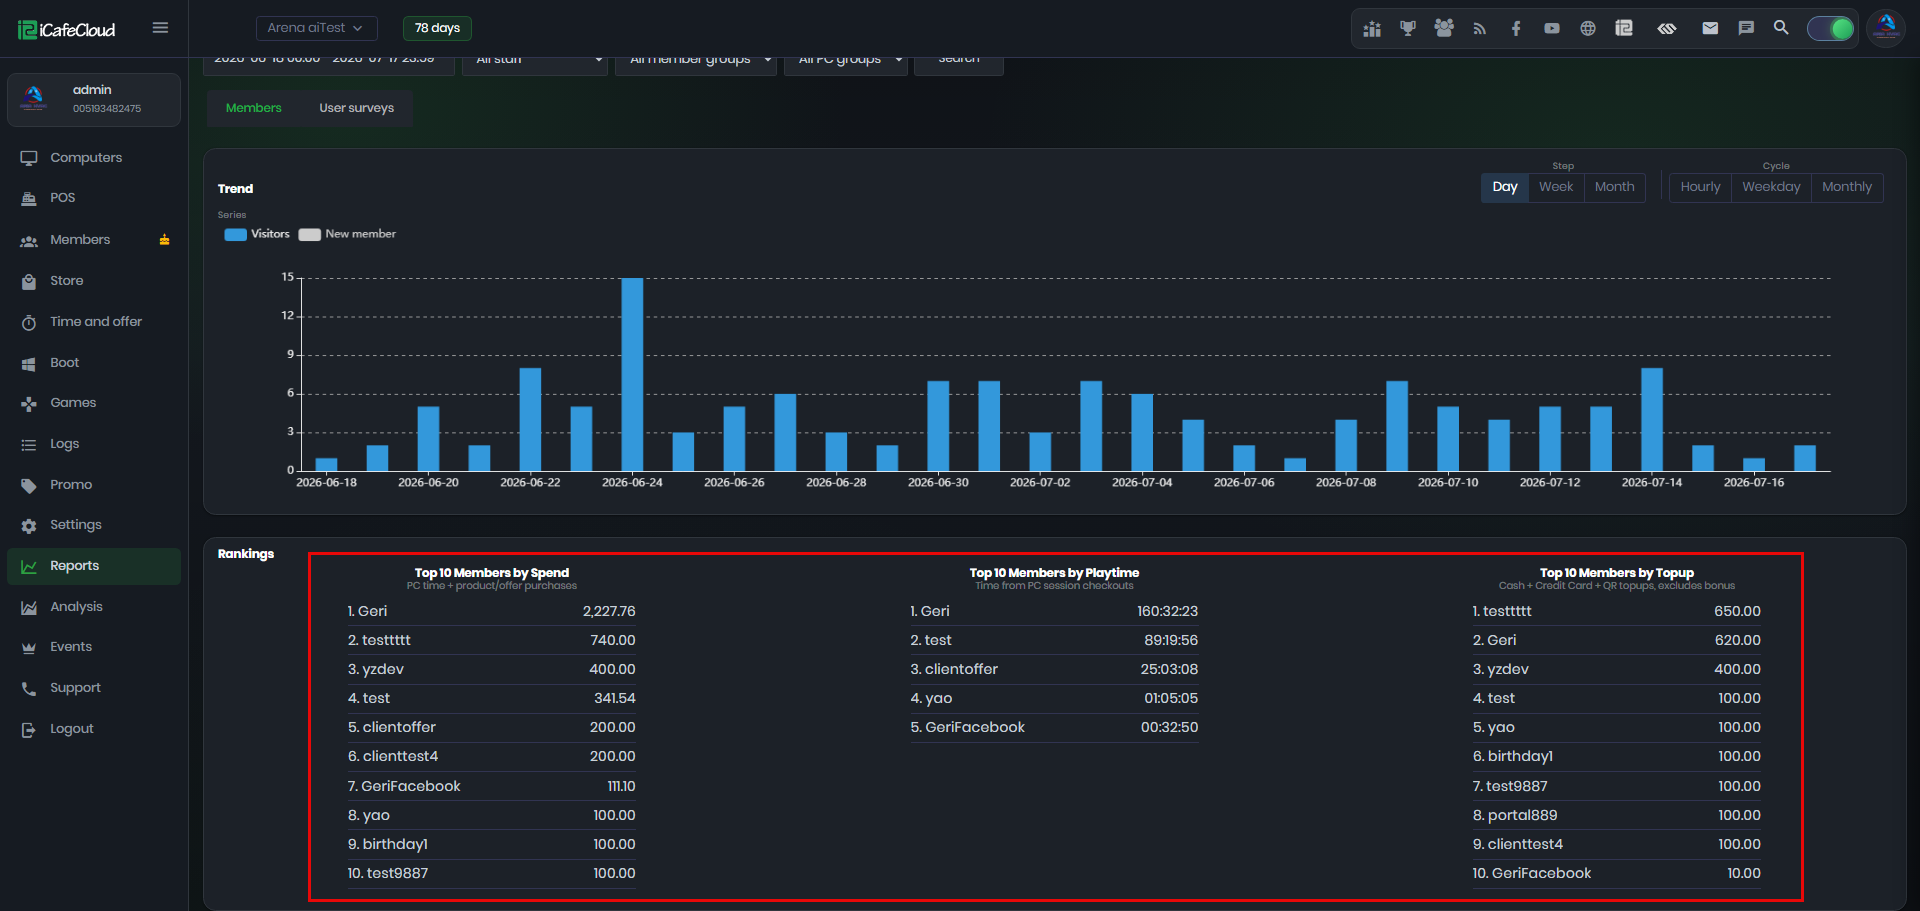
Figure 3
- User surveys – The second sub-tab shows the answers members gave to your user surveys, with a Details table listing each Question, Answer, and Count (how many members gave that answer), plus PDF and CSV export buttons. (Figure 4)
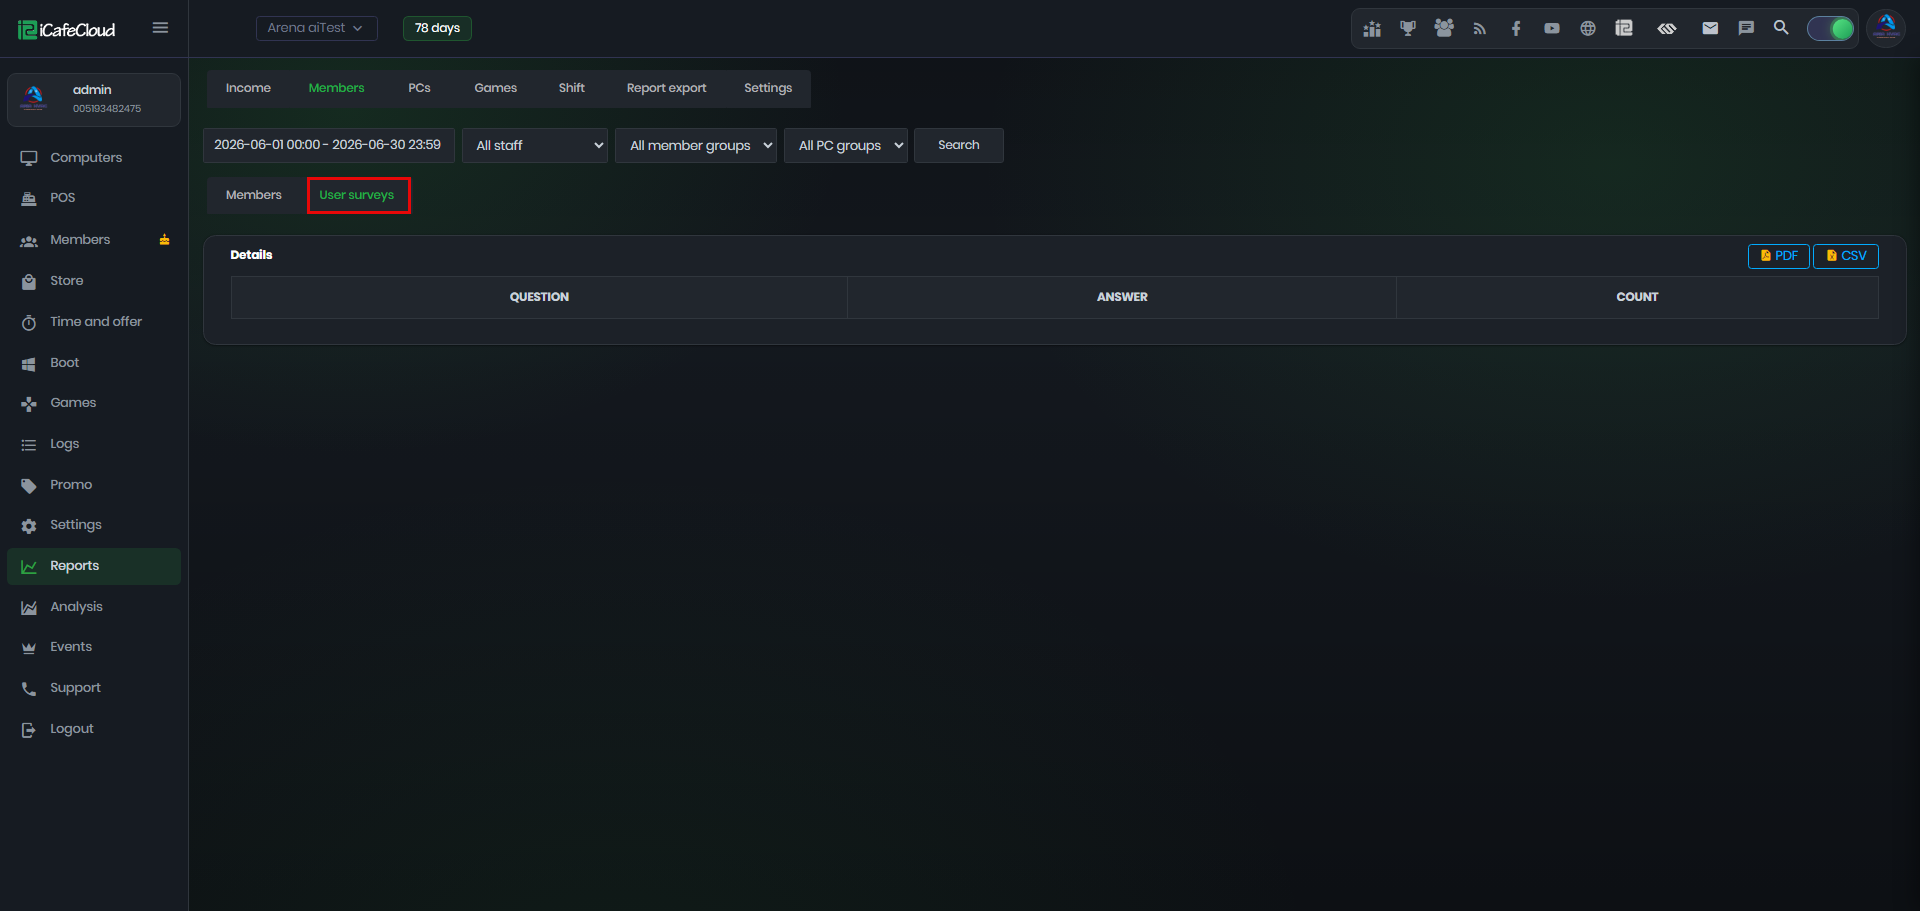
Figure 4
- See User surveys for how to create surveys.