

The following explains how to check PC occupancy, and which PCs have the most usage time or the highest spend amount within a selected date range.
- PC Spend refers to the amount of balance and time used on a specific PC. It does not include time spent using offers or products paid by balance, nor does it include time used through offers.
- To open it, go to Reports - PCs. The report is filtered by the selected date range, staff, member group, and PC group. (Figure 1)
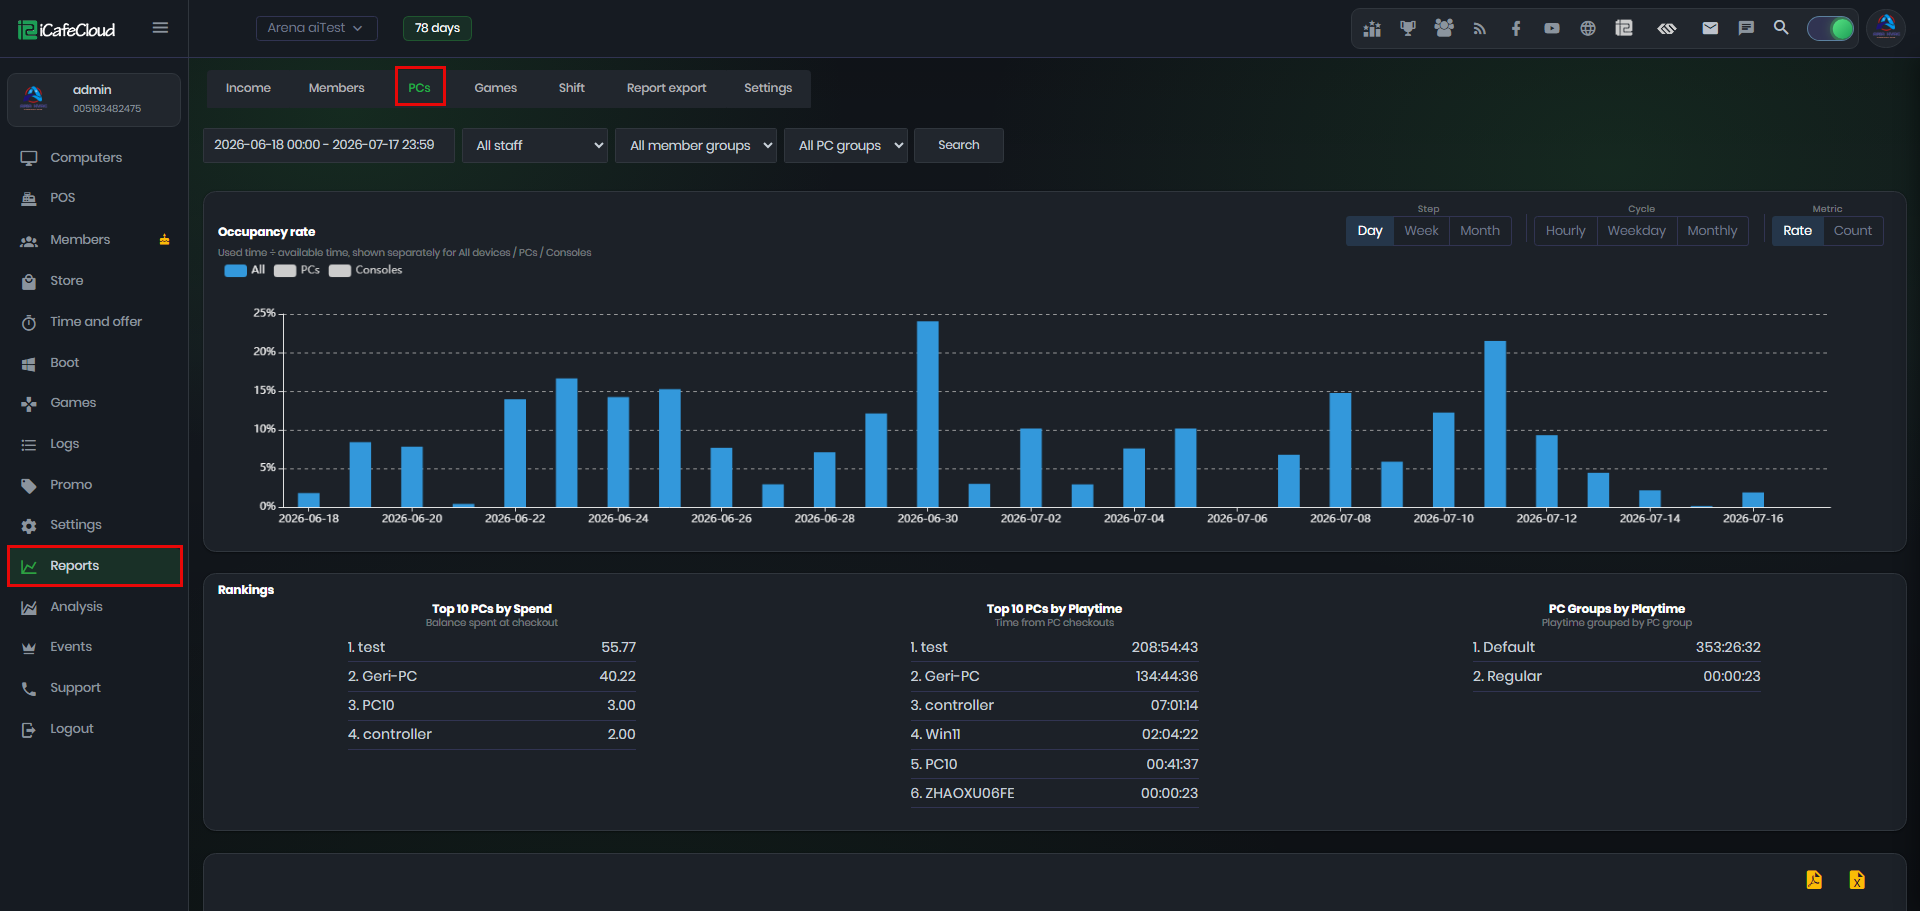
Figure 1
- Occupancy rate – Shows how busy your devices were: used time ÷ available time, with separate lines for All devices, PCs, and Consoles. Click the legend to show or hide each series.
- Step (Day / Week / Month) – Groups the occupancy by calendar period, so you can see how it develops over the date range.
- Cycle (Hourly / Weekday / Monthly) – Groups it by recurring pattern: Hourly shows which hours of the day are the busiest and Weekday shows which days of the week. Useful for planning staffing and opening hours.
- Metric (Rate / Count) – Switches between occupancy as a percentage and as a device count.
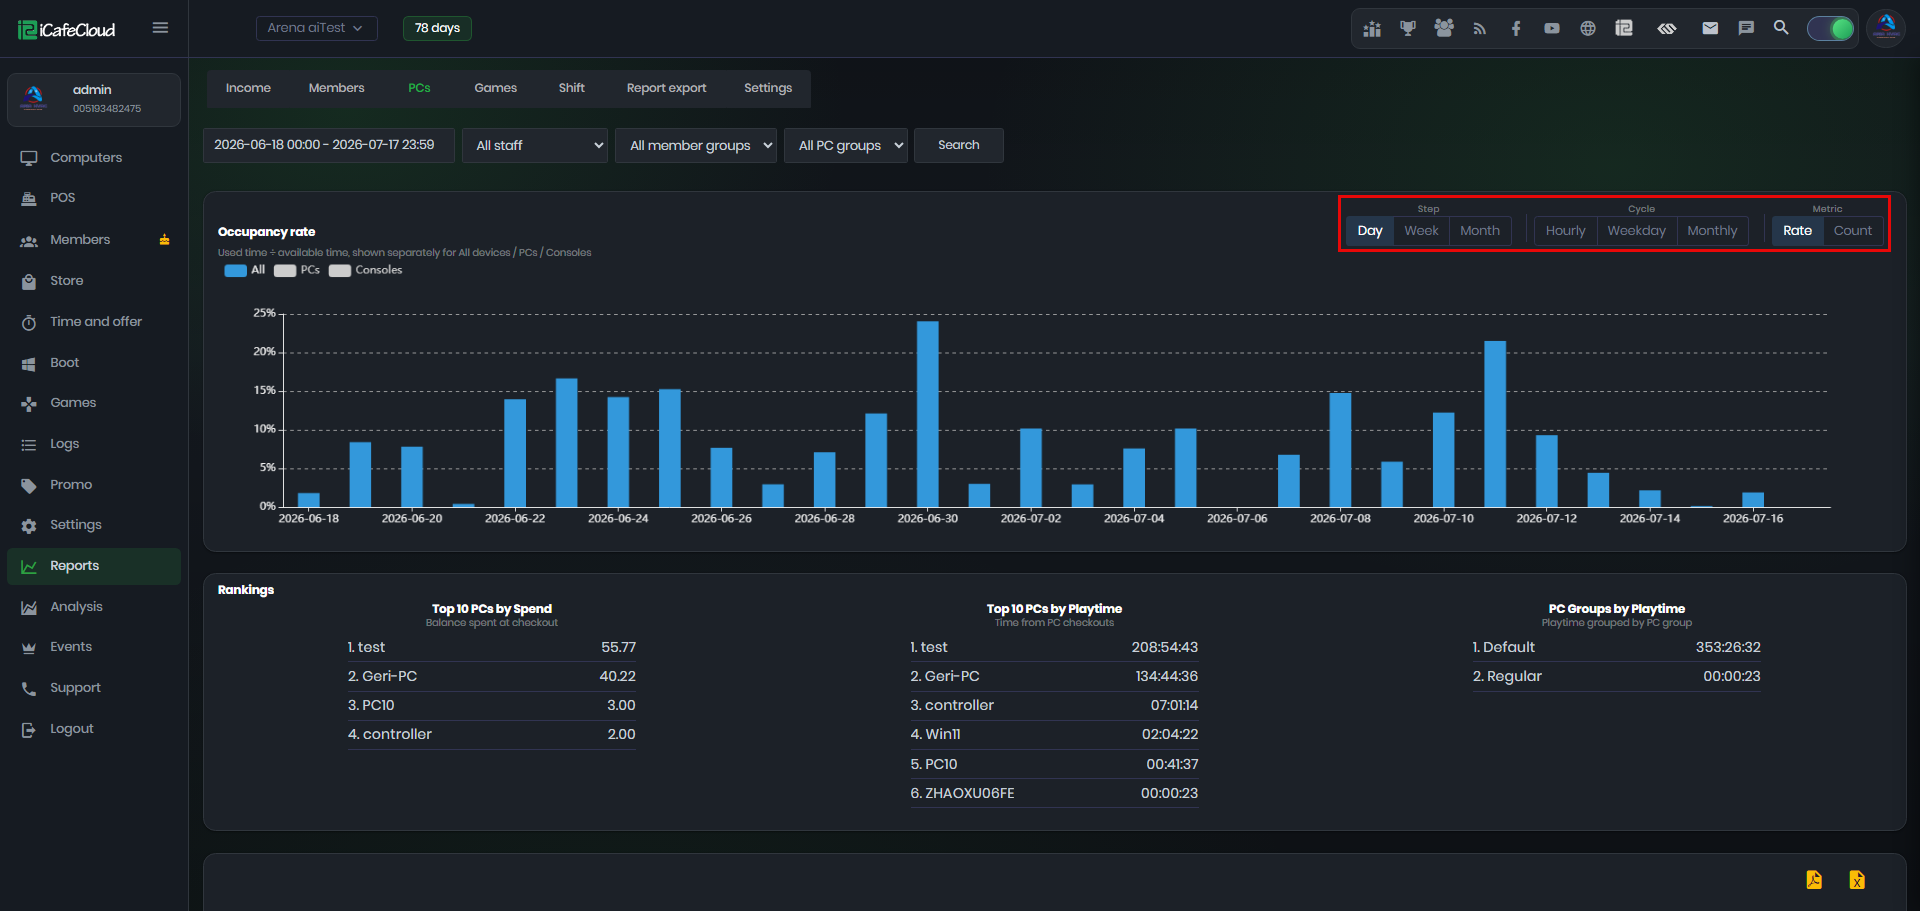
Figure 2
- Rankings – Three lists rank your hardware: (Figure 3)
Top 10 PCs by Spend – The PCs where customers spent the most balance at checkout.
Top 10 PCs by Playtime – The PCs with the most time from PC checkouts.
PC Groups by Playtime – Playtime grouped by PC group, so you can compare areas of the cafe (e.g. VIP room vs. standard floor).
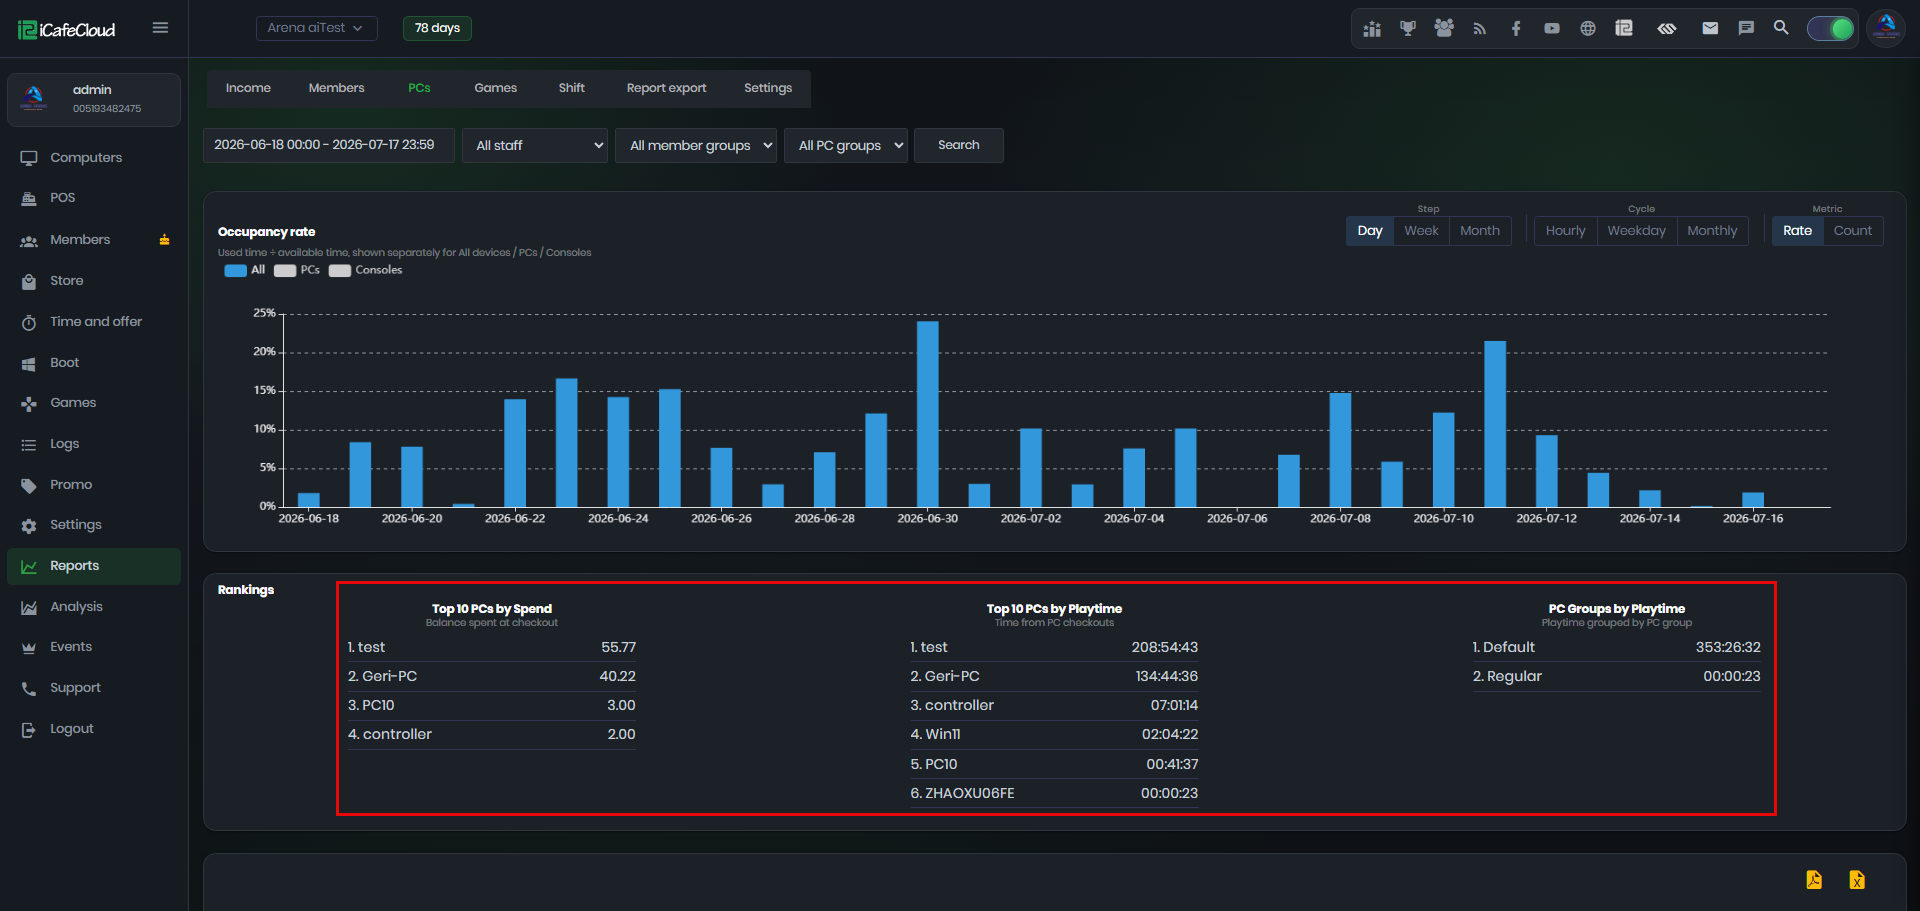
Figure 3
- Details – The table at the bottom lists every PC with its Spend Amount and Spend Time. By default, the list is sorted by most spent time. (Figure 4)
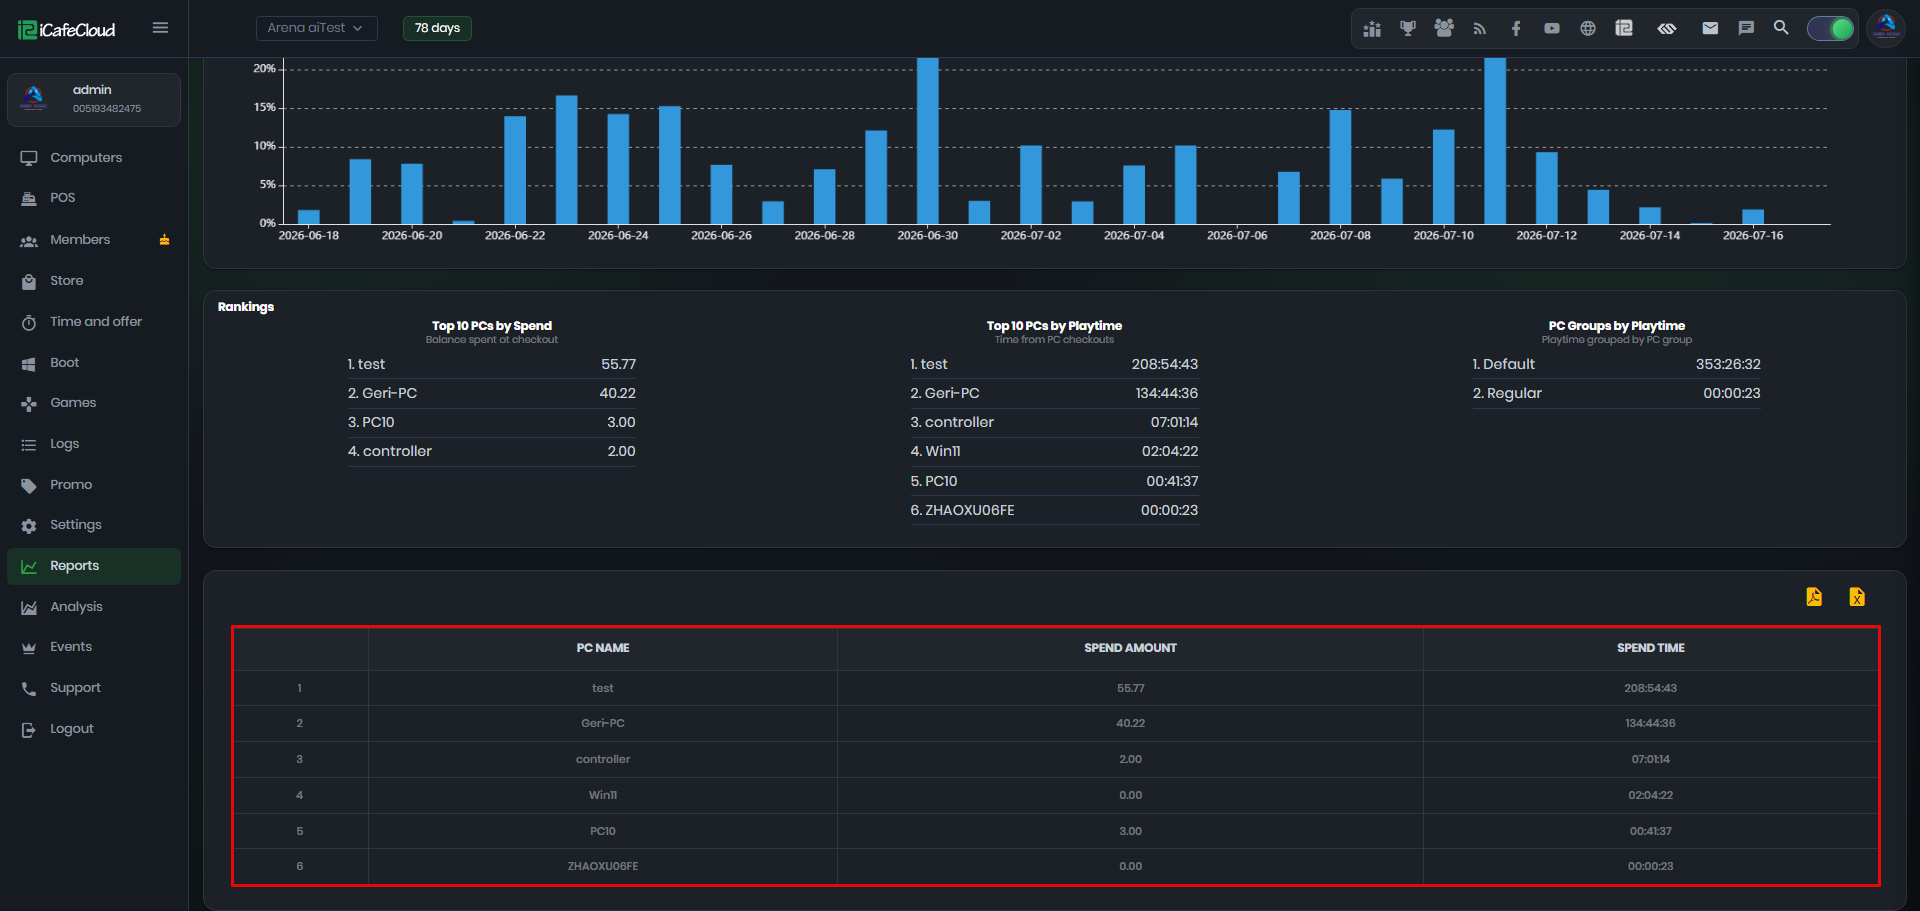
Figure 4
- You can change the sorting order by clicking on the column headers. Clicking "Spend Amount" sorts from highest to lowest; clicking it a second time sorts from lowest to highest.
- Use the yellow PDF and Excel icons in the top-right corner of the table to download the PC list. (Figure 4)