

The following explains the Income report, which gives a complete overview of your cafe's revenue for a selected period: the trend chart, the income breakdown by payment method and revenue source, and the Details table with all formulas.
- To open it, go to Reports - Income in the panel menu. The Income page is divided into four sub-tabs:
Total – Combined view of all income (topups, offers, and product sales together).
Topup – Income from member balance topups only.
Offers – Income from time offers only.
Products – Income from product (shop) sales only.
- Top of the page – The Trend chart and the Breakdown section, giving a visual overview of income over time, by payment method, and by revenue source. (Figure 1)
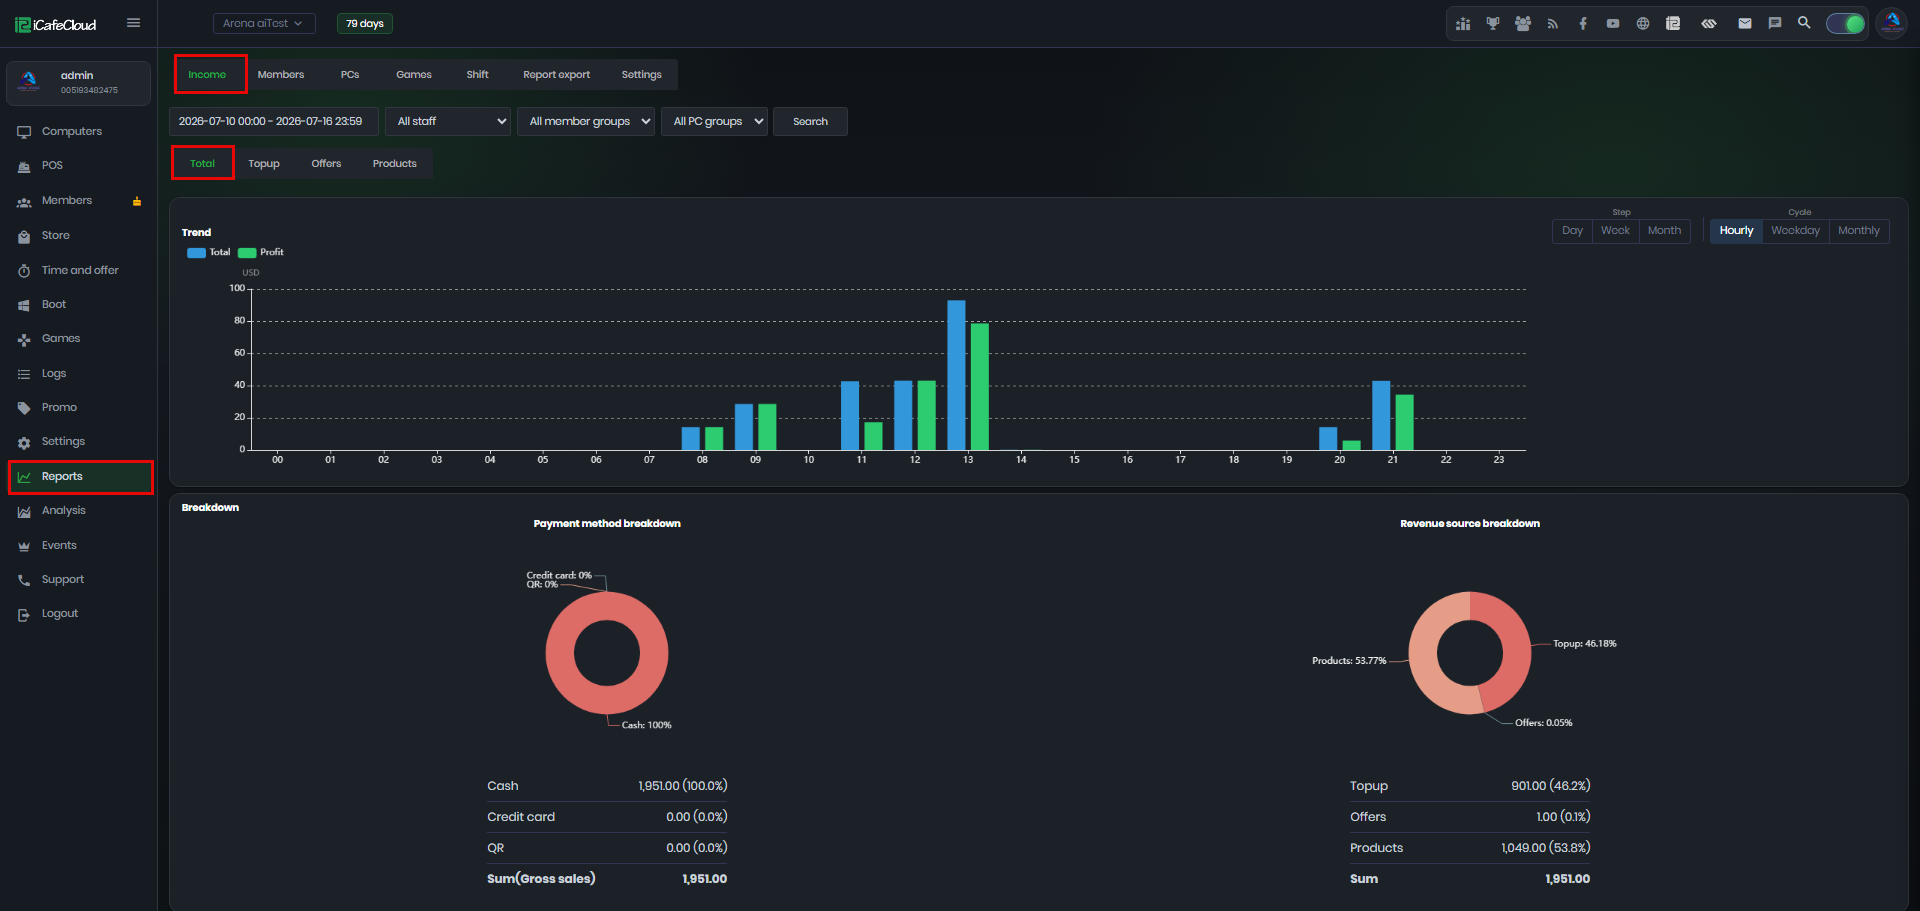
Figure 1
- Bottom of the page – The Details table, listing every income figure for the period together with the formula used to calculate it, plus PDF and CSV export buttons. (Figure 2)
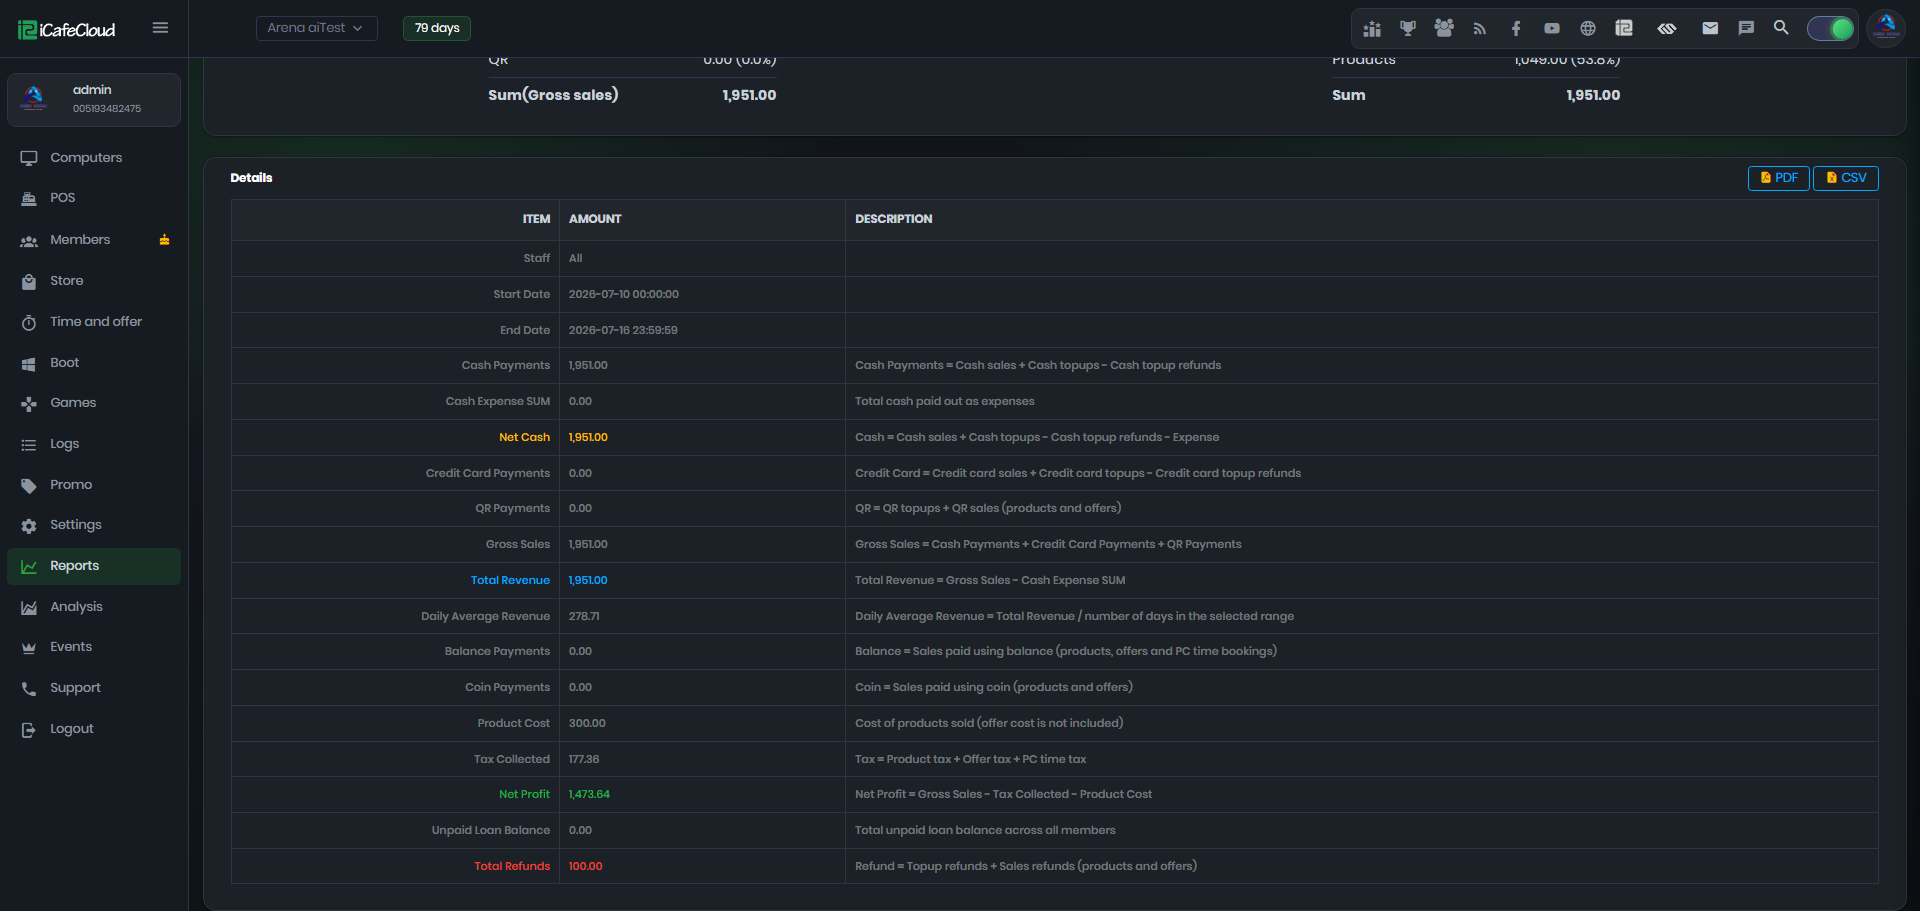
Figure 2
- The Trend chart displays two bars for each time slot (Figure 3)
Total (blue) – Gross income for that slot.
Profit (green) – Profit for that slot.
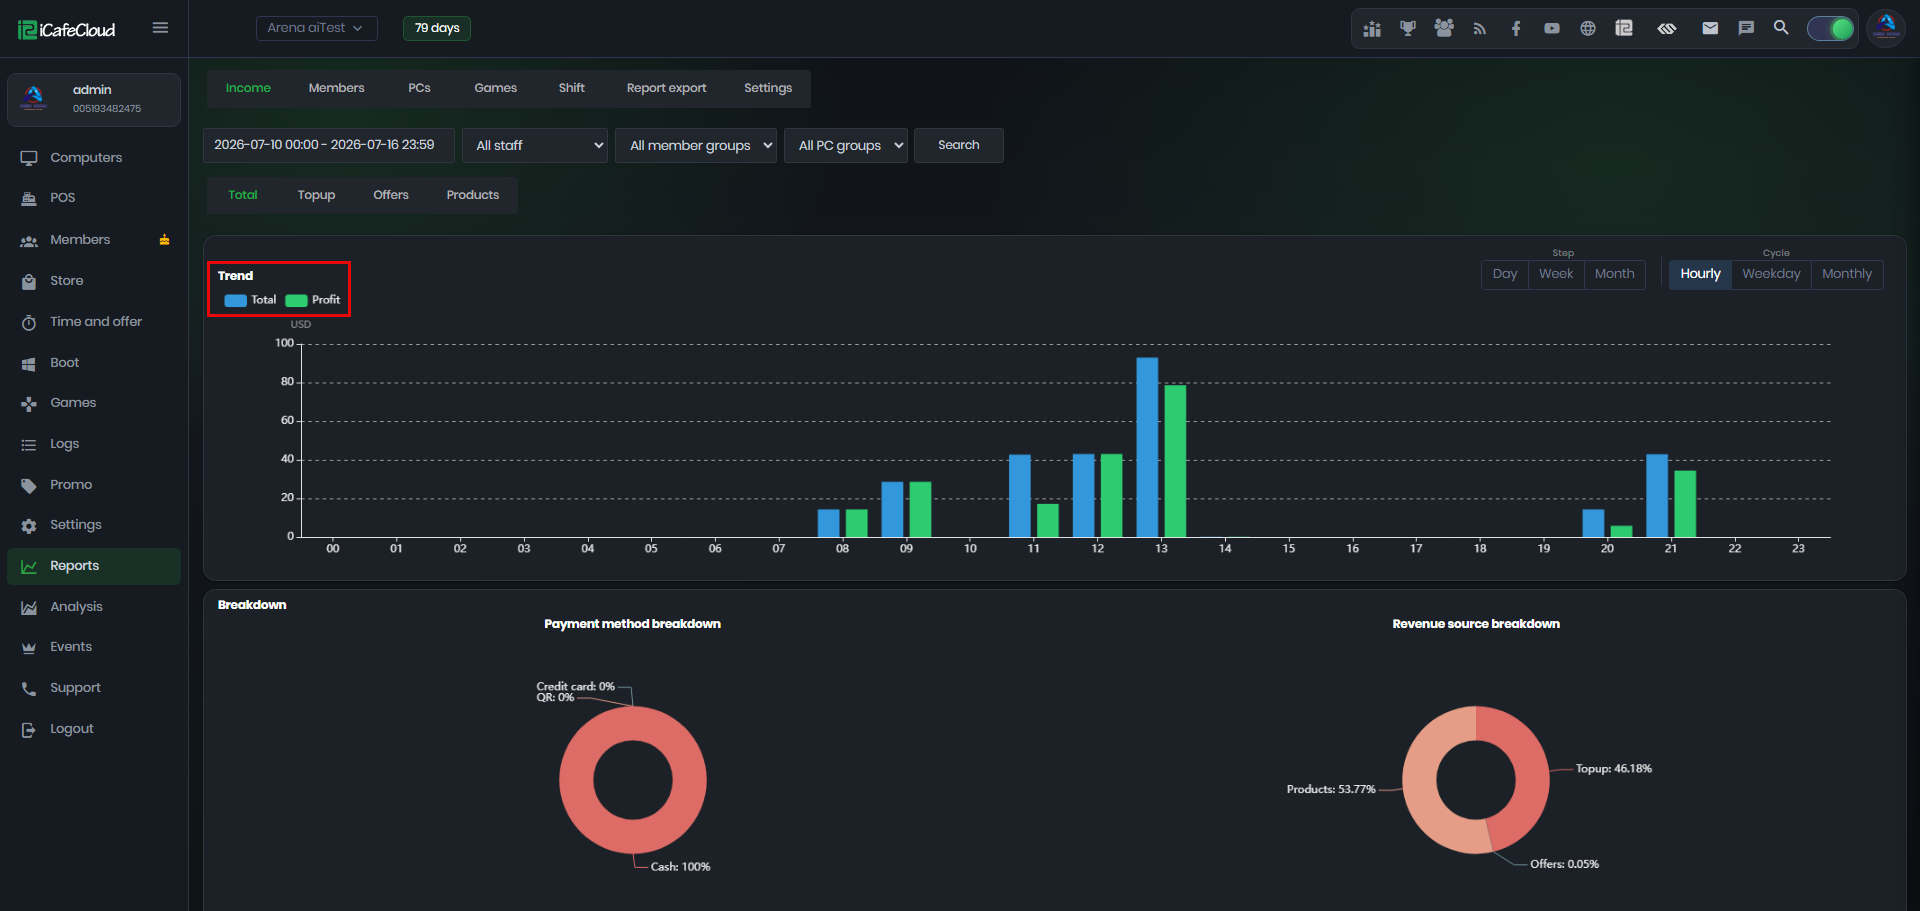
Figure 3
- Two controls in the top-right corner change how the data is grouped:
Step (Day / Week / Month) – Groups the income by calendar period, so you can see how income develops over the selected date range. (Figure 4)
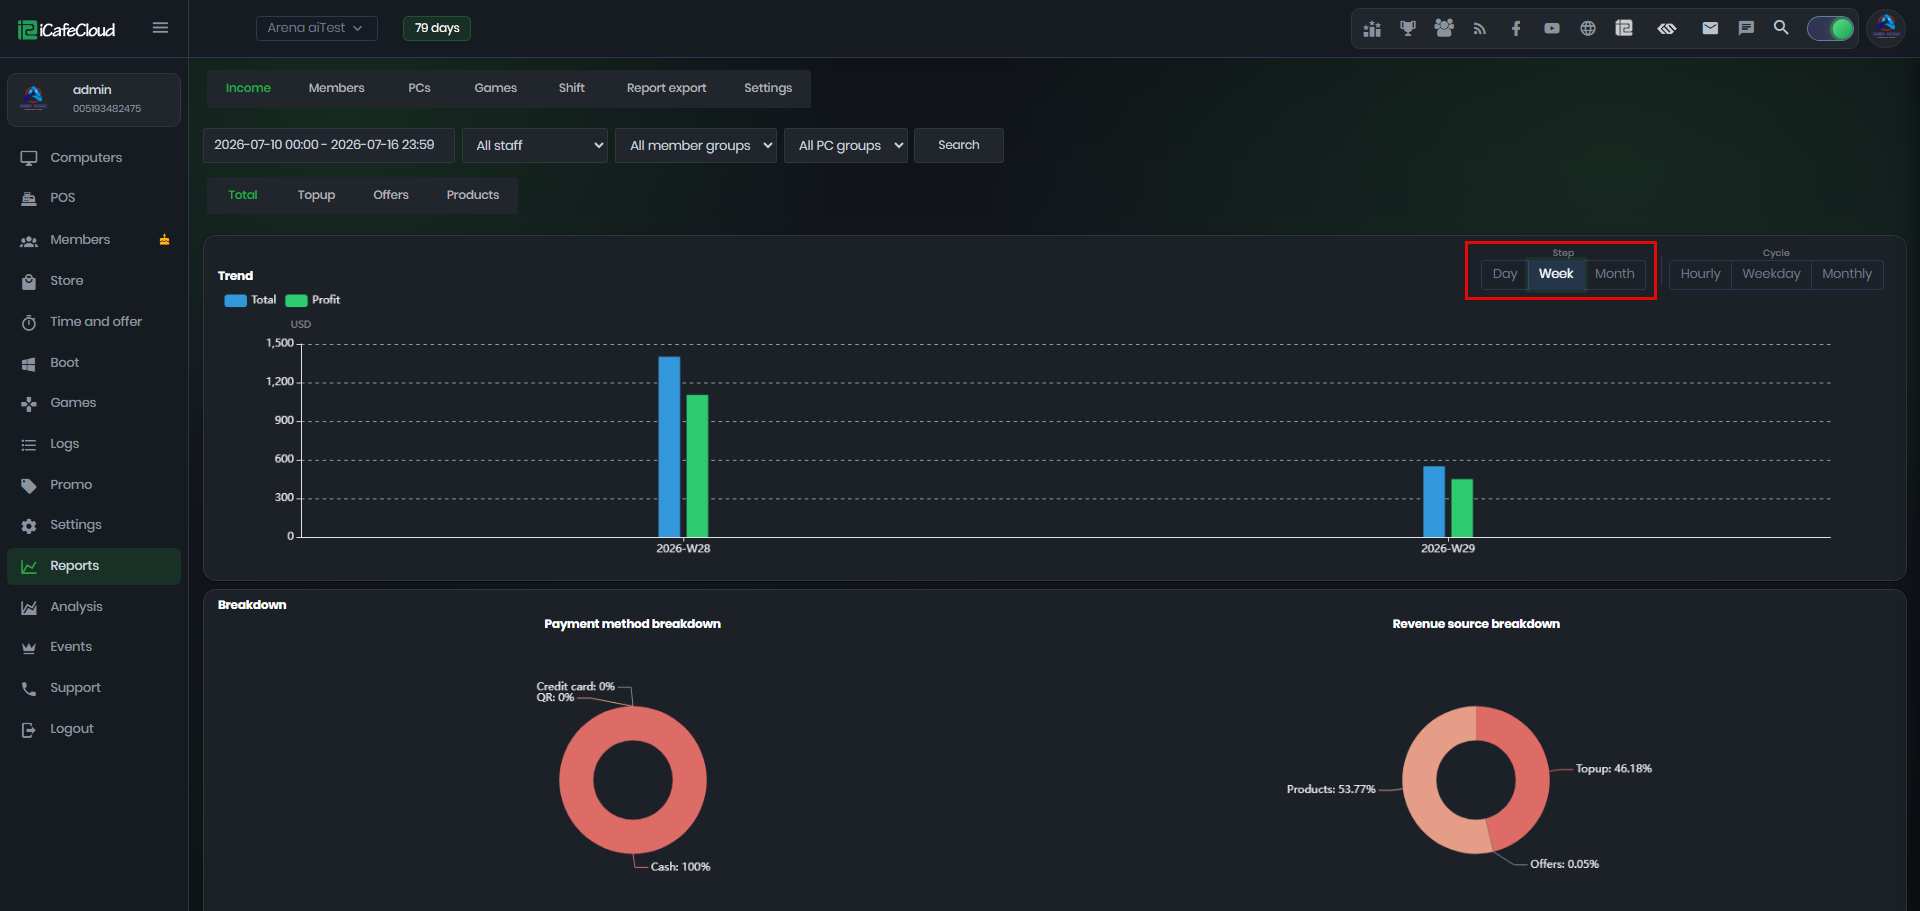
Figure 4
- Cycle (Hourly / Weekday / Monthly) – Groups the income by recurring pattern. For example, Hourly shows which hours of the day (00–23) generate the most income, and Weekday shows which days of the week are busiest. This is useful for planning staffing and opening hours.(Figure 5)
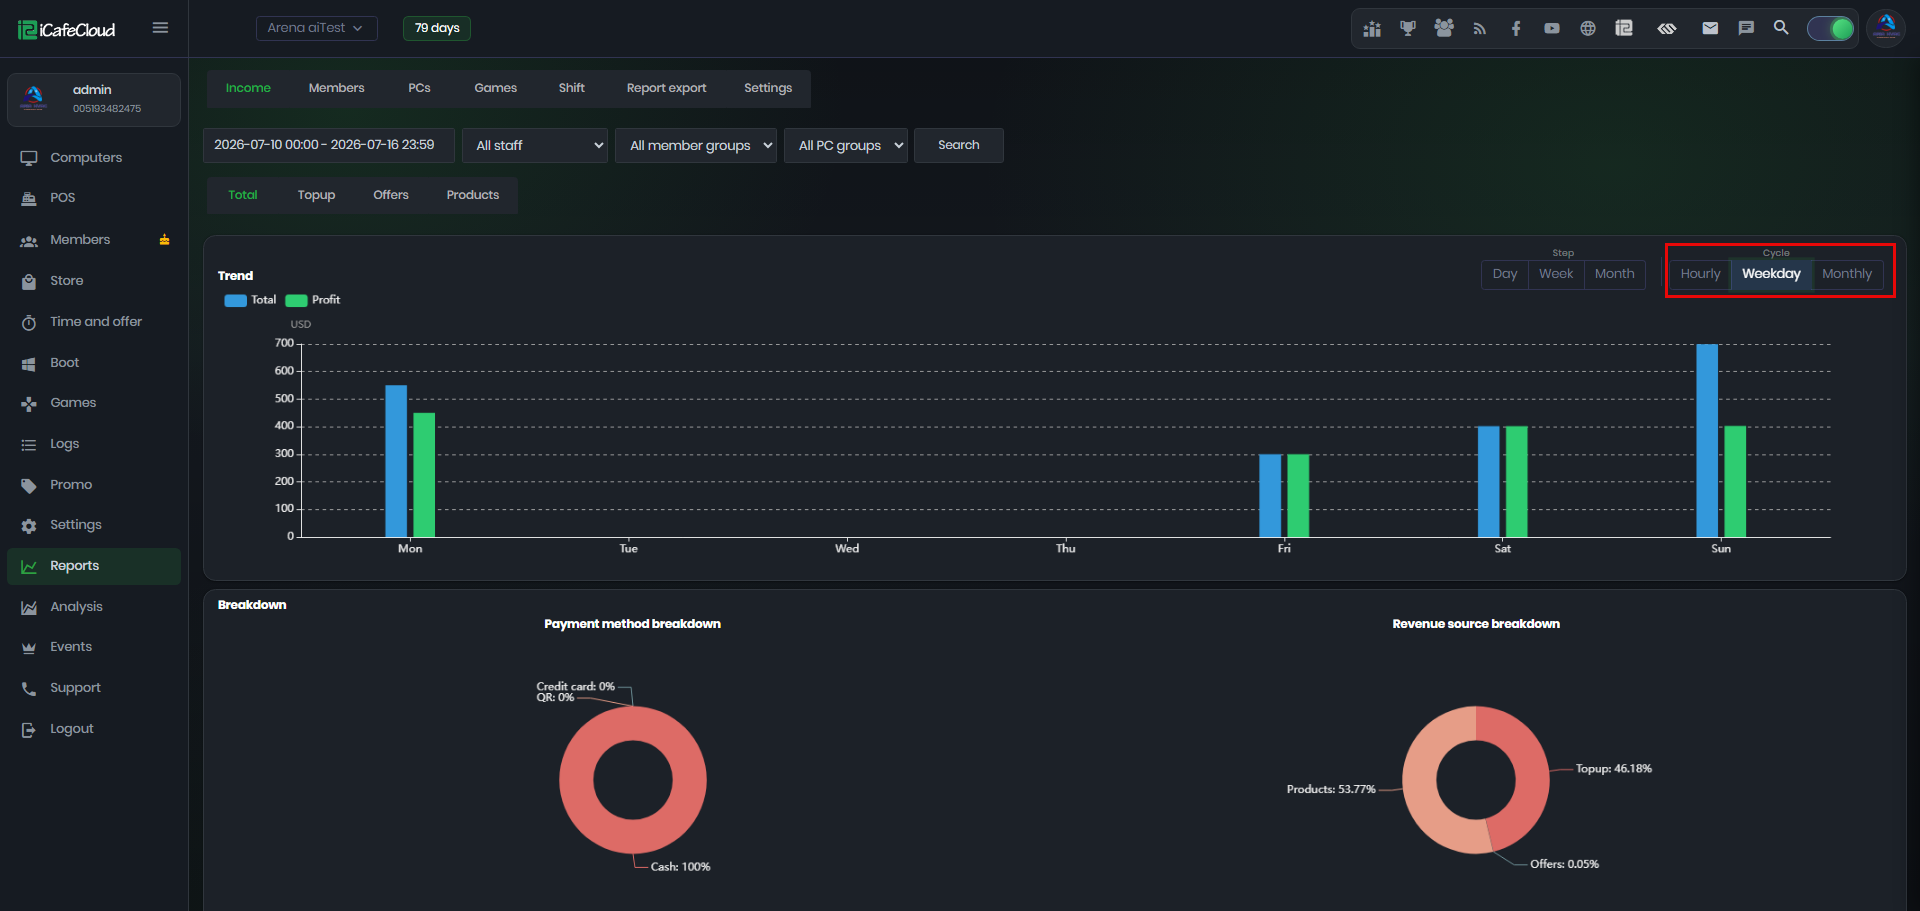
Figure 5
- Payment method breakdown shows how customers paid, as an amount and percentage of the total (Figure 6)
Cash
Credit card
QR
Sum (Gross sales) – The total of all payment methods.
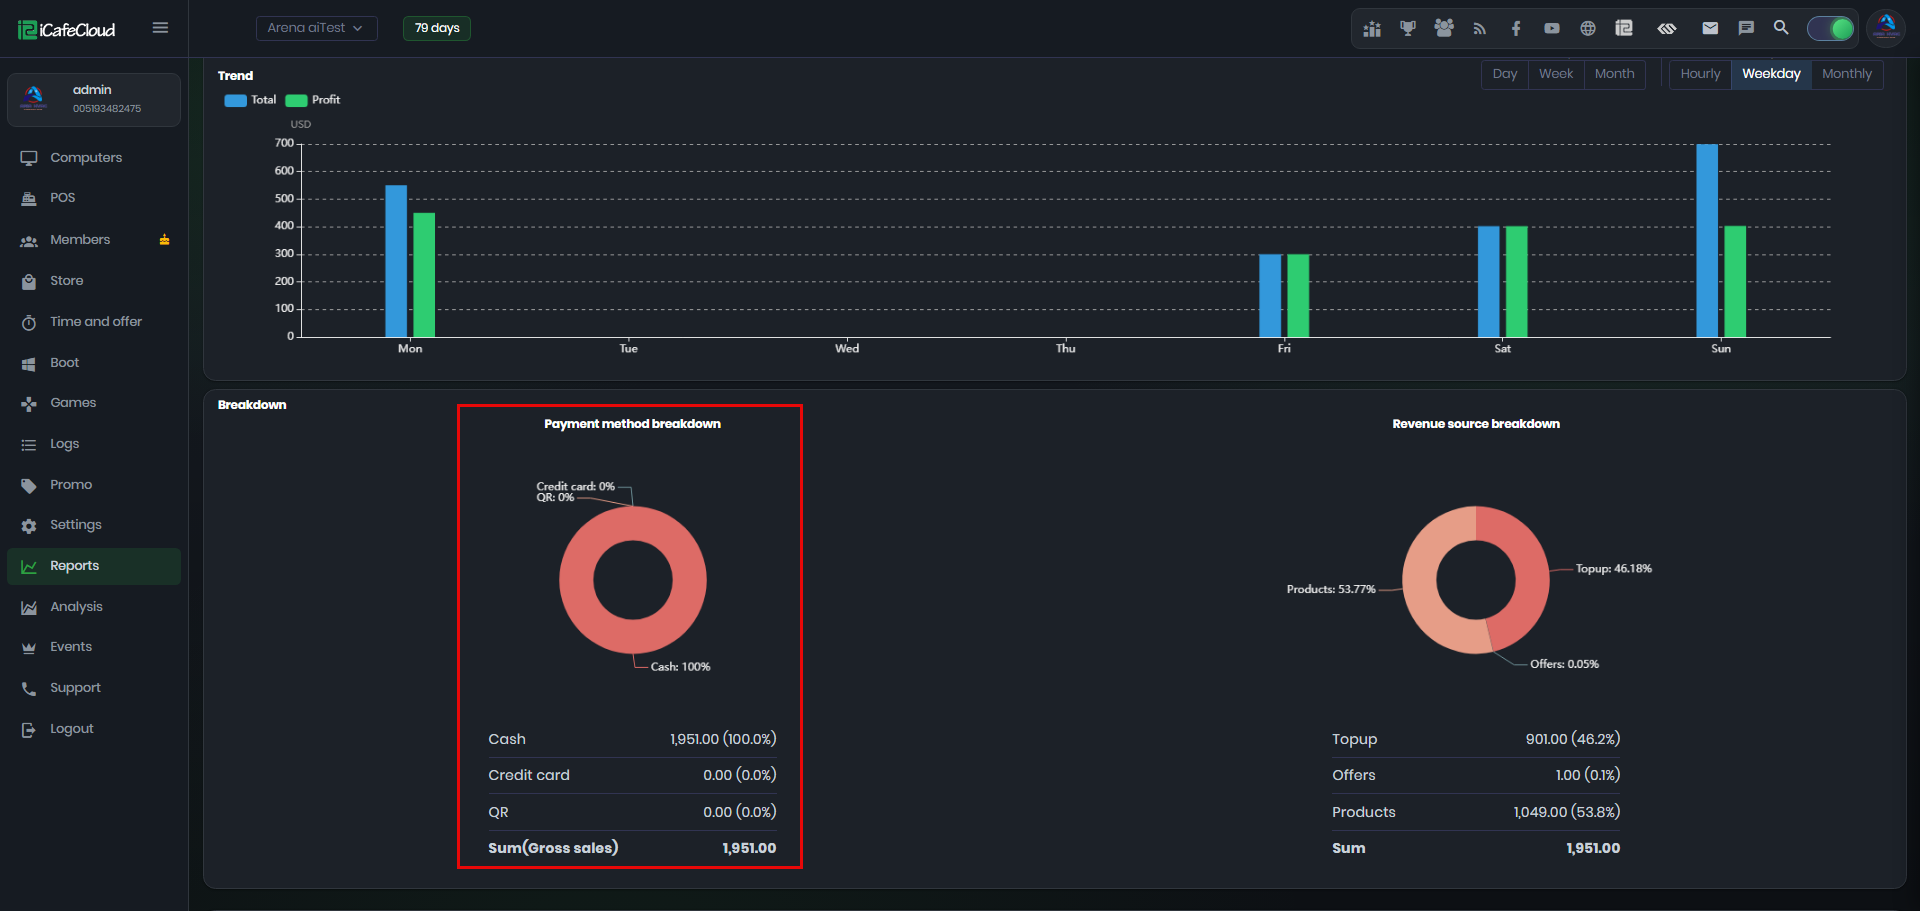
Figure 6
- Revenue source breakdown shows where the income came from (Figure 7)
Topup – Member balance topups.
Offers – Time offers purchases.
Products – Shop/product sales.
Sum – The total of all revenue sources.
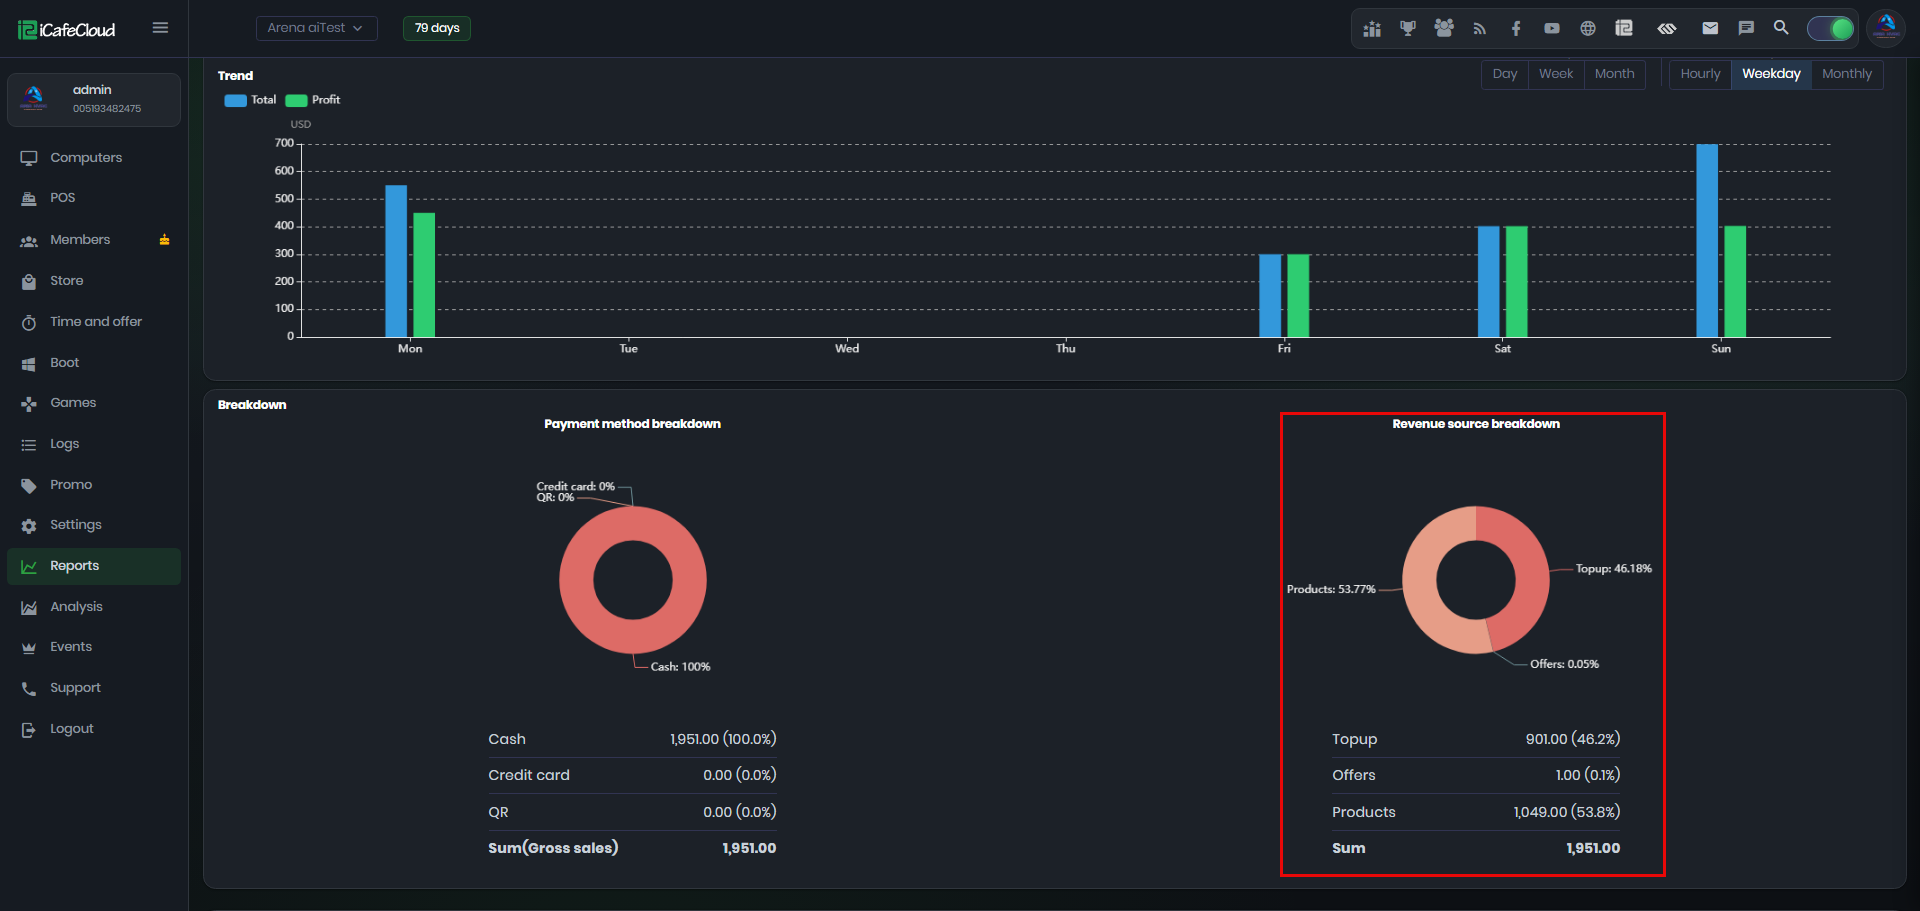
Figure 7
Details table formulas
- Cash Payments = Cash sales + Cash topups − Cash topup refunds
- Cash Expense SUM = Total cash paid out as expenses
- Net Cash = Cash Payments − Cash Expense SUM
Ex: Cash Payments 1,951.00 − Expenses 0.00 = Net Cash 1,951.00. If you had paid out 50.00 in cash expenses, Net Cash would be 1,901.00 while Gross Sales stays 1,951.00. - Credit Card Payments = Credit card sales + Credit card topups − Credit card topup refunds
- QR Payments = QR topups + QR sales (products and offers)
- Gross Sales = Cash Payments + Credit Card Payments + QR Payments
Ex: 1,951.00 + 0.00 + 0.00 = Gross Sales 1,951.00 - Total Revenue = Gross Sales − Cash Expense SUM
Ex: 1,951.00 − 0.00 = Total Revenue 1,951.00 - Daily Average Revenue = Total Revenue ÷ days in the selected range
Ex: 1,951.00 ÷ 7 days = 278.71 - Balance Payments = Sales paid using member balance (products, offers, and PC time bookings)
- Coin Payments = Sales paid using coins (products and offers)
- Product Cost = Cost of products sold (offer cost is not included)
- Tax Collected = Product tax + Offer tax + PC time tax
- Net Profit = Gross Sales − Tax Collected − Product Cost
Ex: 1,951.00 − 177.36 − 300.00 = Net Profit 1,473.64 - Unpaid Loan Balance = Total unpaid loan balance across all members
- Total Refunds = Topup refunds + Sales refunds (products and offers)
- Balance Payments and Coin Payments are informational and are not added to Gross Sales. Balance was already counted as income when the member topped up, and coins are a separate currency.
- The key figures are highlighted in the table: Net Cash and Total Revenue show the money actually taken in, Net Profit (green) shows the profit after cost and tax, and Total Refunds (red) shows the amount refunded in the period.