2023-12-29
Data range, Chart, Income, Tax, profit, cash, expenses
The following guide provides an overview of all the data available on the Report page.
- Accessing Income and Profit Report in iCafeCloud
- Log in to the iCafeCloud web admin.
- Navigate to the "Reports" section on the left side of the interface ( Figure 1).
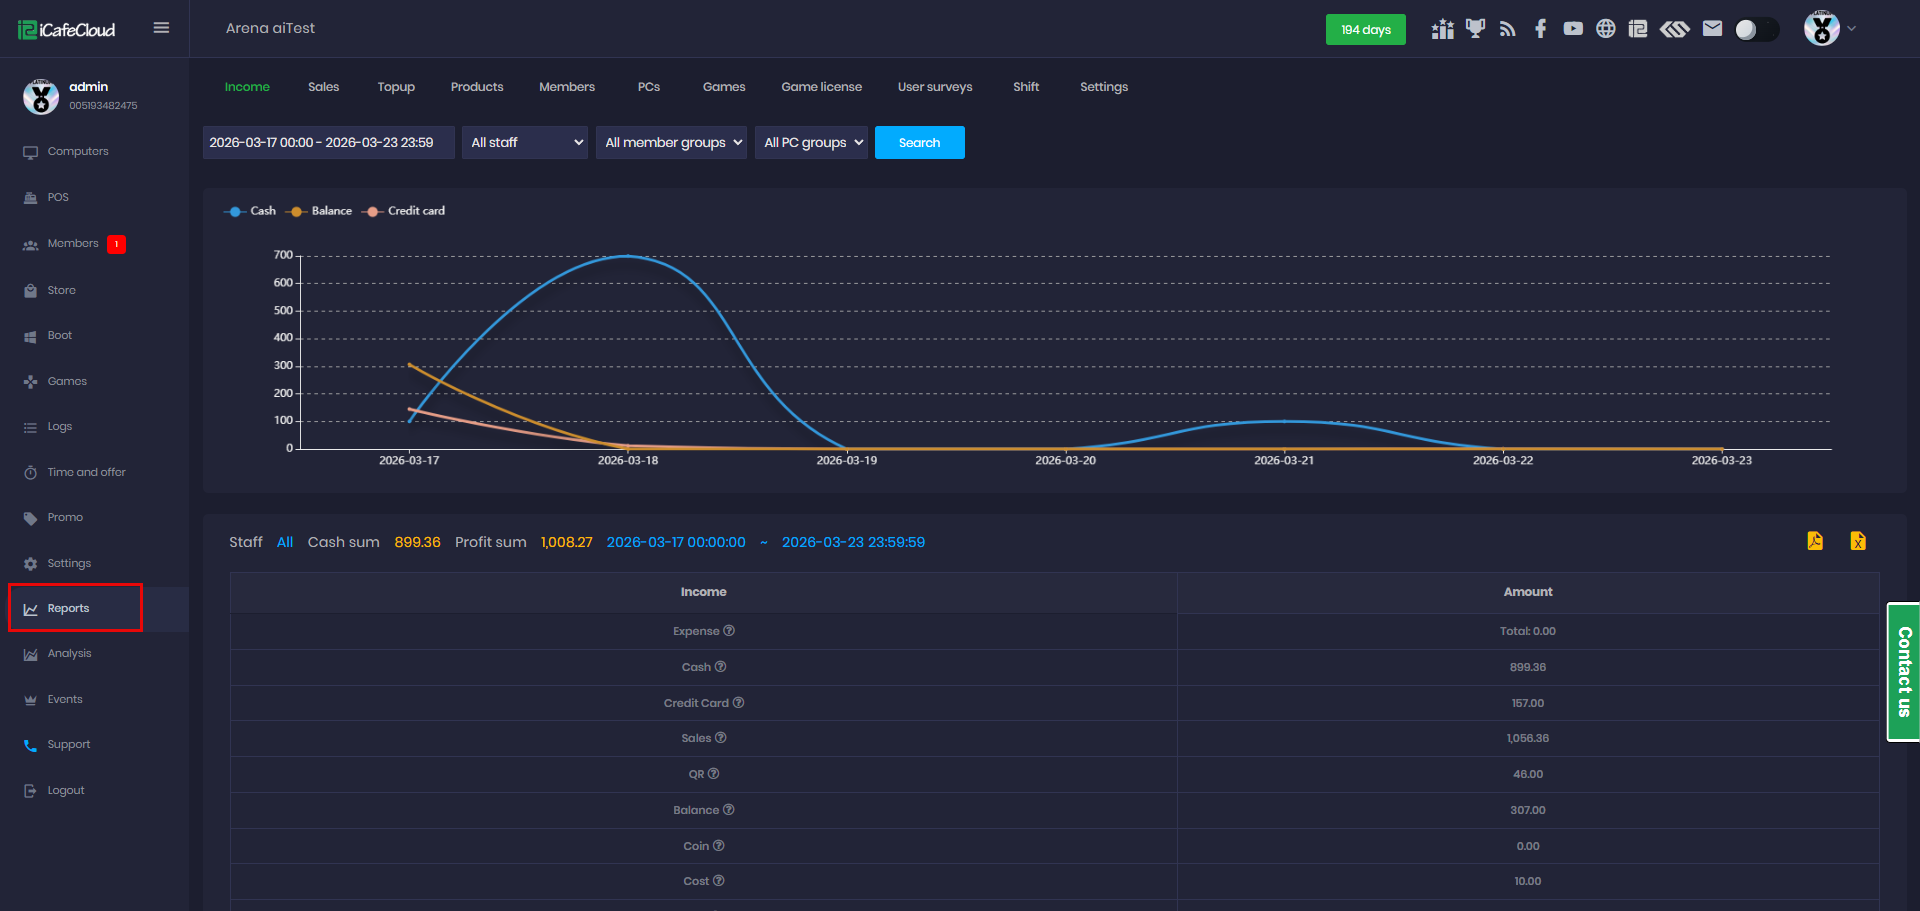
Figure 1
- Income: Detailed breakdown of current income for a clear understanding of revenue streams.
- Sales: Comprehensive information on sales for tracking and analyzing transactional data.
- Topup: Insights into top-up activities to understand customer behavior in replenishing balances.
- Products: Detailed overview of product performance for product management and sales optimization.
- Members: Details about the customer base for analyzing membership trends and customer loyalty.
- Pcs: The report shows the top PCs by spending amount and the time spent using balance.
- Games: Information on gaming-related activities, if applicable, to assess popularity and profitability.
- Game License: shows how many license requests were made and how many shortages occurred.
- User Survey: displays the data from surveys submitted by users.
- Shift: Select all staff or a specific staff member to view related report data.
- Setting: Allows staff to access reports and bind to Google Drive to upload logs.
- Data Range Select: Customize the timeframe for data analysis.
Select Report by Staff: Filter the report by staff member.
Member Groups: Choose to view reports for all member groups or a specific group.
PC Groups: Choose to view reports for all PC groups or a specific group.
- Chart: Visual representation of business data, revealing trends and patterns.(Figure 2)
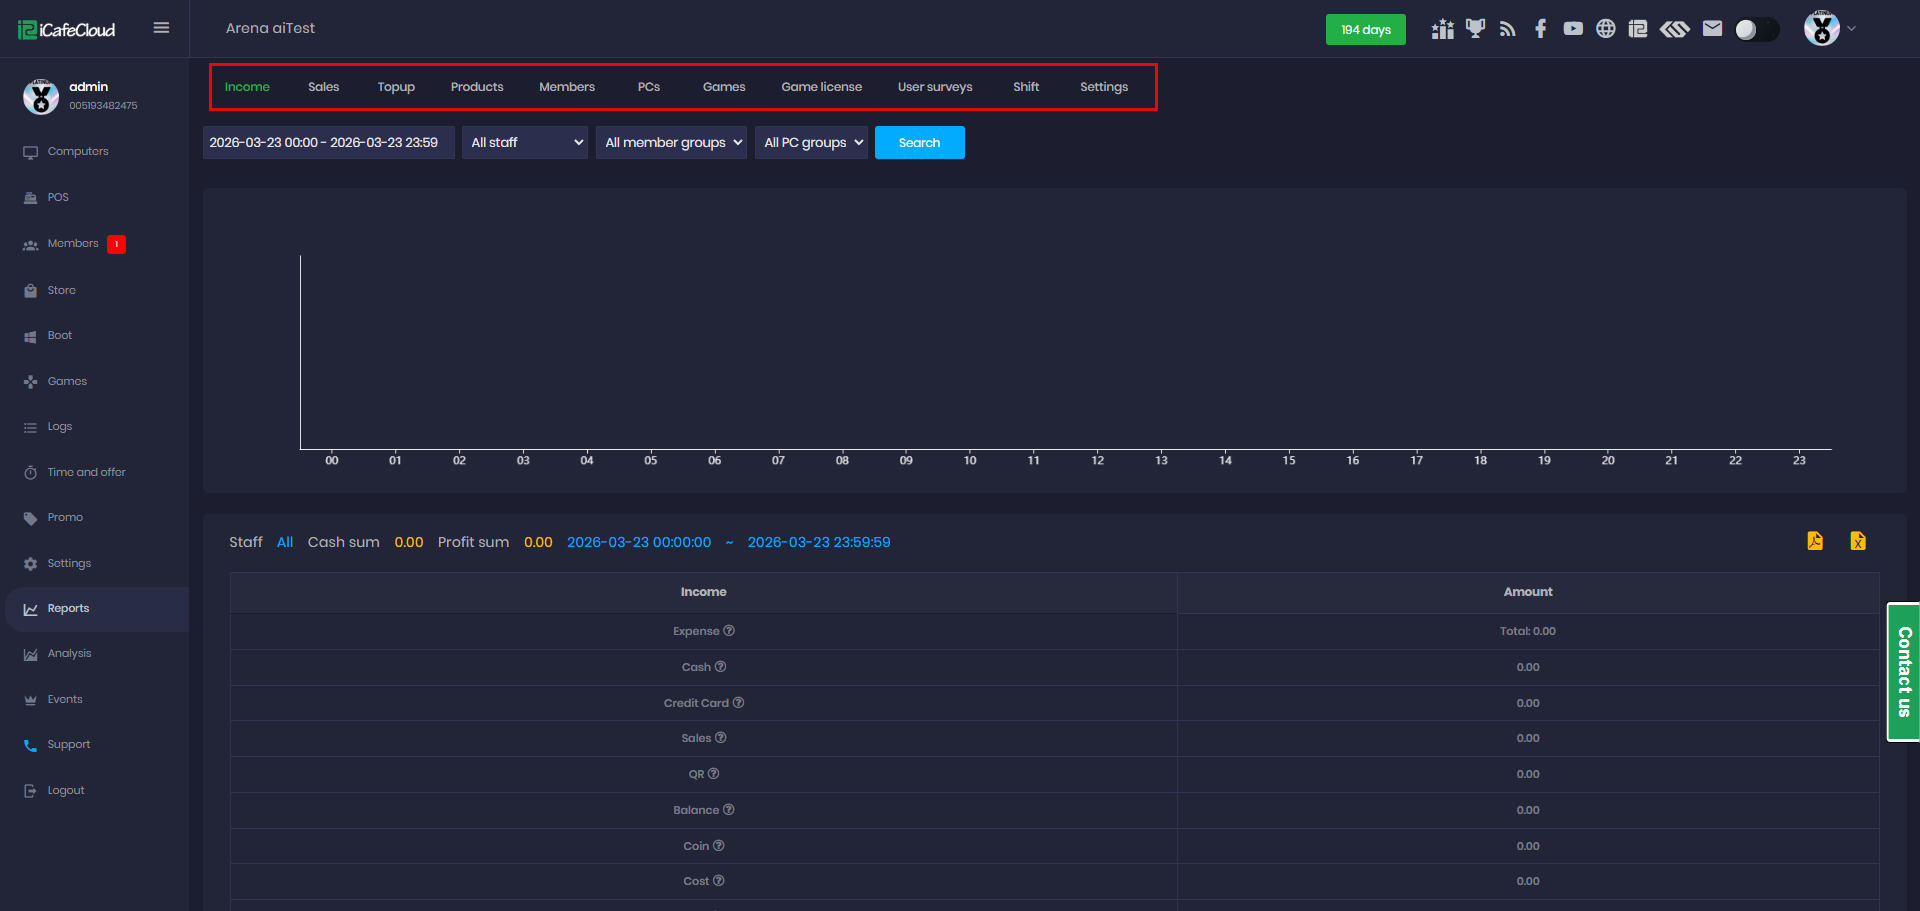
Figure 2