

Internet Cafe Reporting Software
You cannot fix what you cannot see. iCafeCloud reports the money, the machines and the members from the same data the billing engine writes — so the number on the dashboard and the number in the till come from the same place.
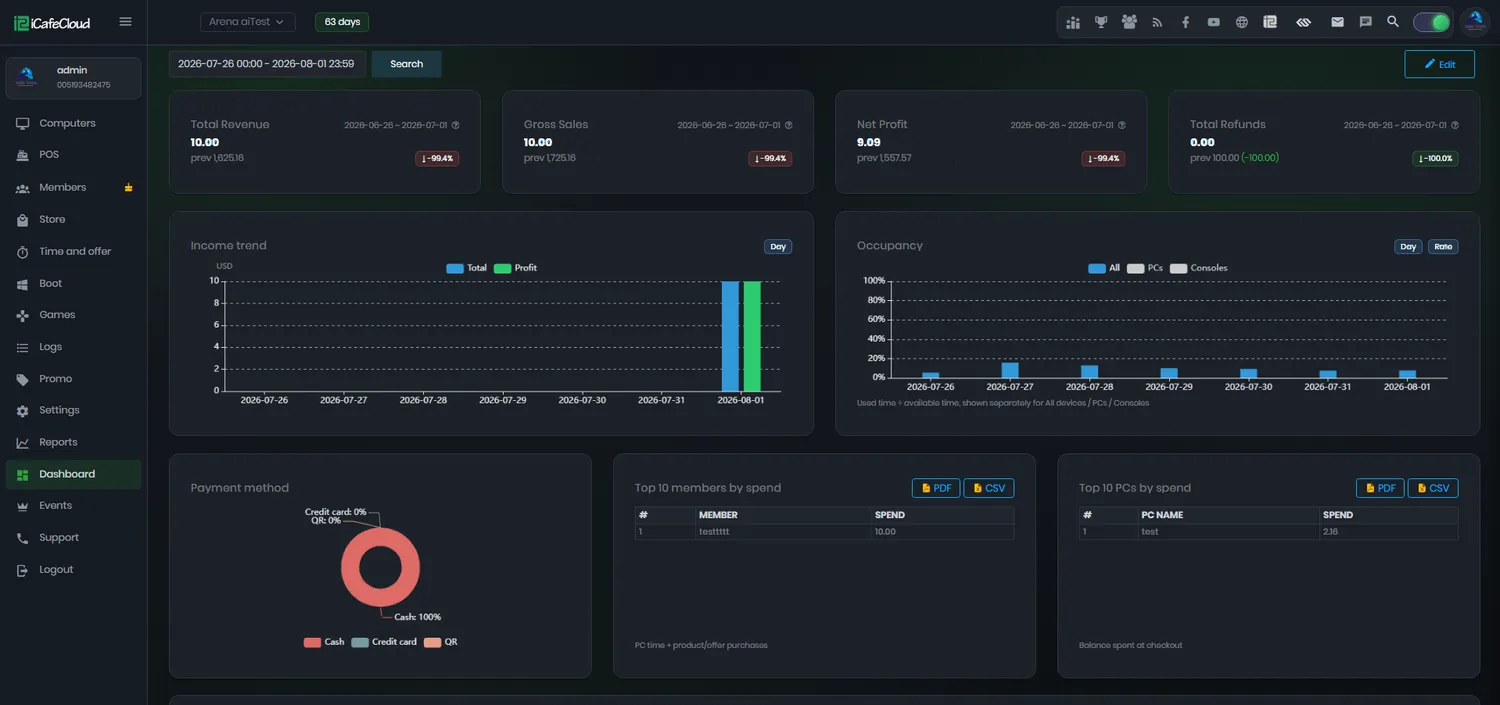
What you can report on
Income
Revenue for any period, split by payment method and by where it came from: PC time, offers, products and top-ups.
Top-ups
Balance loaded onto accounts, filtered by date range, staff member, member group and PC group.
Offers
Which time packages sell, at what price, and to which member groups — so you stop running the ones that only ever lose you margin.
Products
Shop sales item by item, with the stock movements behind them.
Games
Game usage and game license use, so you can see which titles justify their disk space and which accounts justify their cost.
Members
New accounts, activity over the period and the answers to any user surveys you are running.
Shifts
Employee start and end times with the totals each one took, in cash and by card, for the handover that actually balances.
Comparison
Put this month next to last month, or this week next to the same week last year, and see the direction rather than the number.
Where the money came from
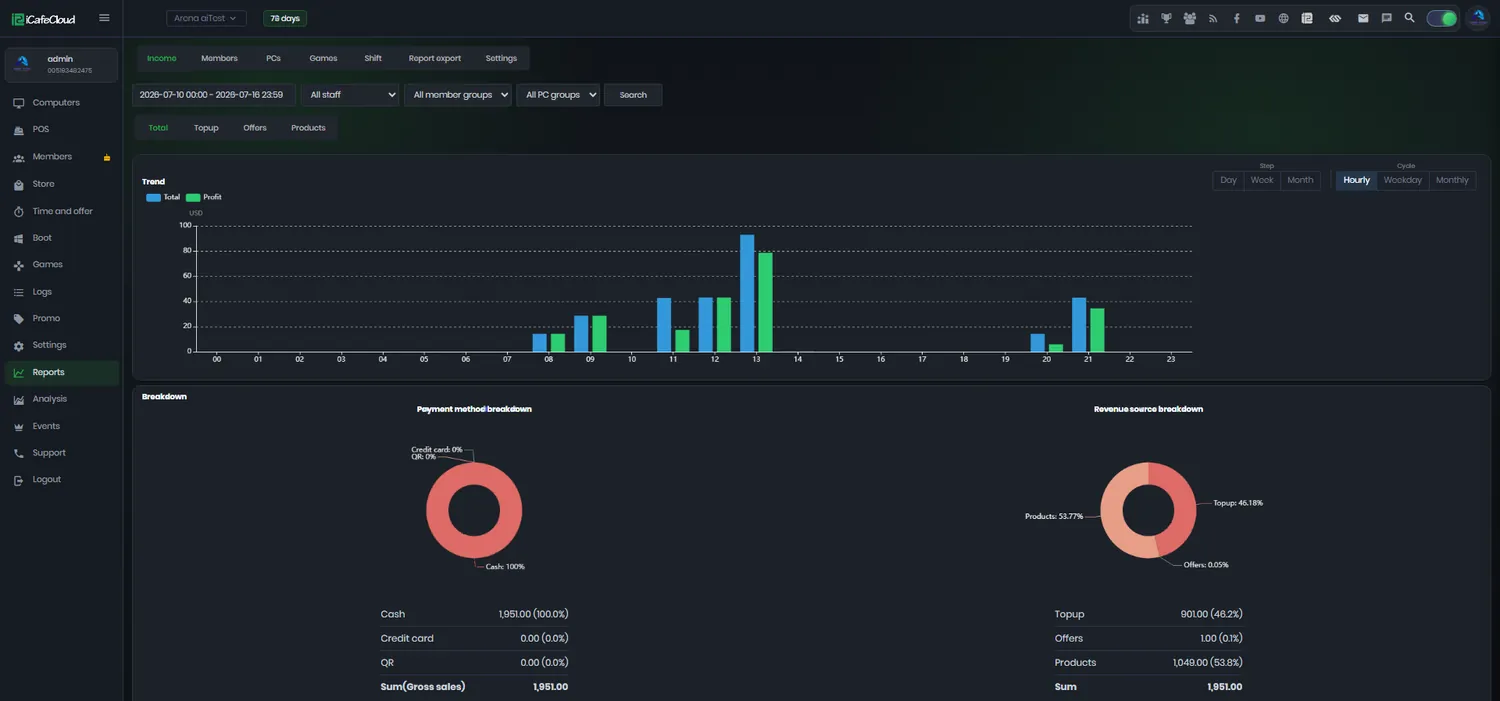
The Income report pairs a trend chart with a breakdown by payment method and by revenue source, then a Details table underneath that lists the formula behind every line.
That last part matters more than it sounds. When a total looks wrong, you can follow it back to the calculation instead of arguing about it, which is the difference between a report you use and a report you stop trusting.
The same filters run through everything
Every report on the page takes the same set of filters, so moving from income to offers to members does not mean setting the window up again.
Presets cover today, yesterday, this month and last month; beyond that you pick your own range, down to the hour.
- Date range — presets or a custom window
- Staff member, for shift and till reconciliation
- Member group, to see what each tier is worth
- PC group, to compare the VIP row against the rest
- Shift, with employee start and end times
Which titles earn their disk space
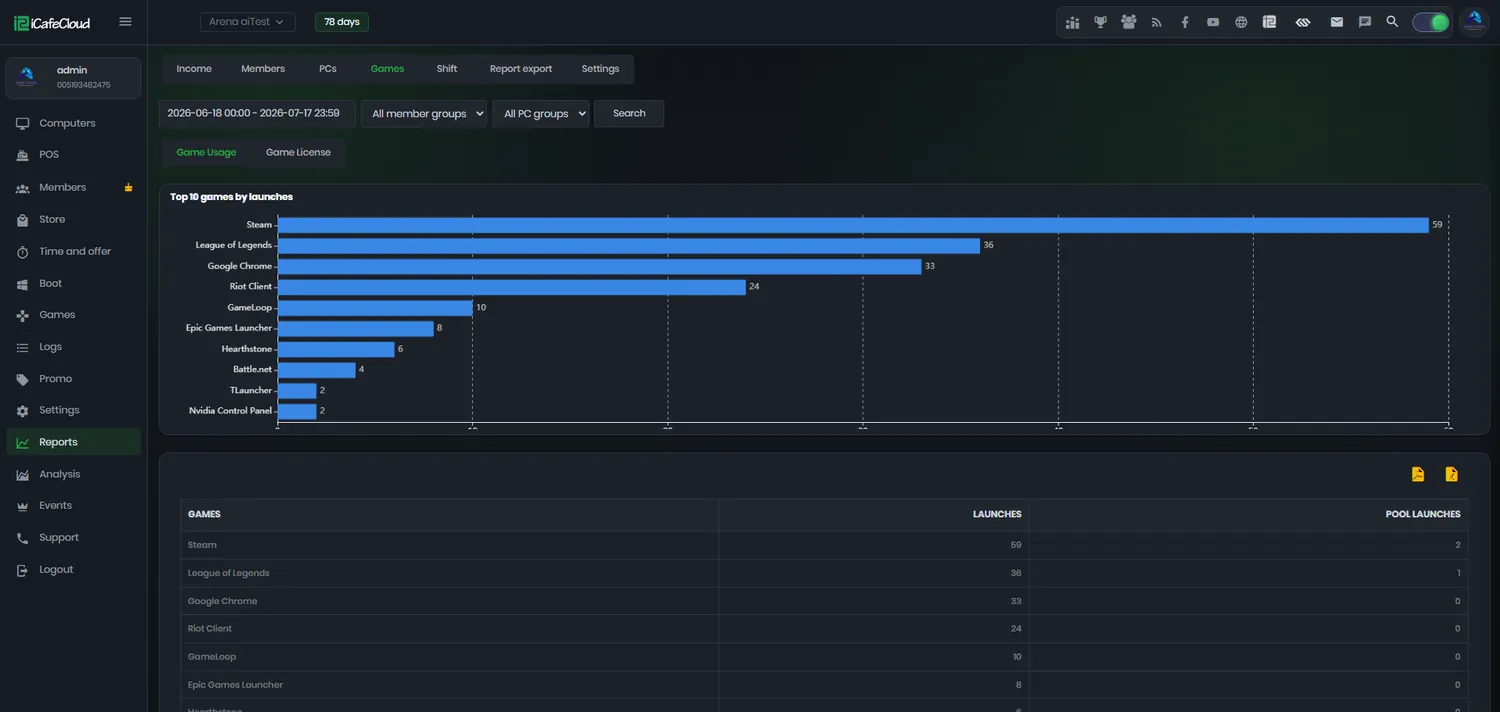
The Games report ranks titles by how often they were actually played in the period, and shows license usage next to it.
A game nobody launches is occupying a game disk you paid for. A game everyone launches but which keeps reporting license shortages is costing you sessions. Both show up here before they show up in your income.
Trends, not just totals
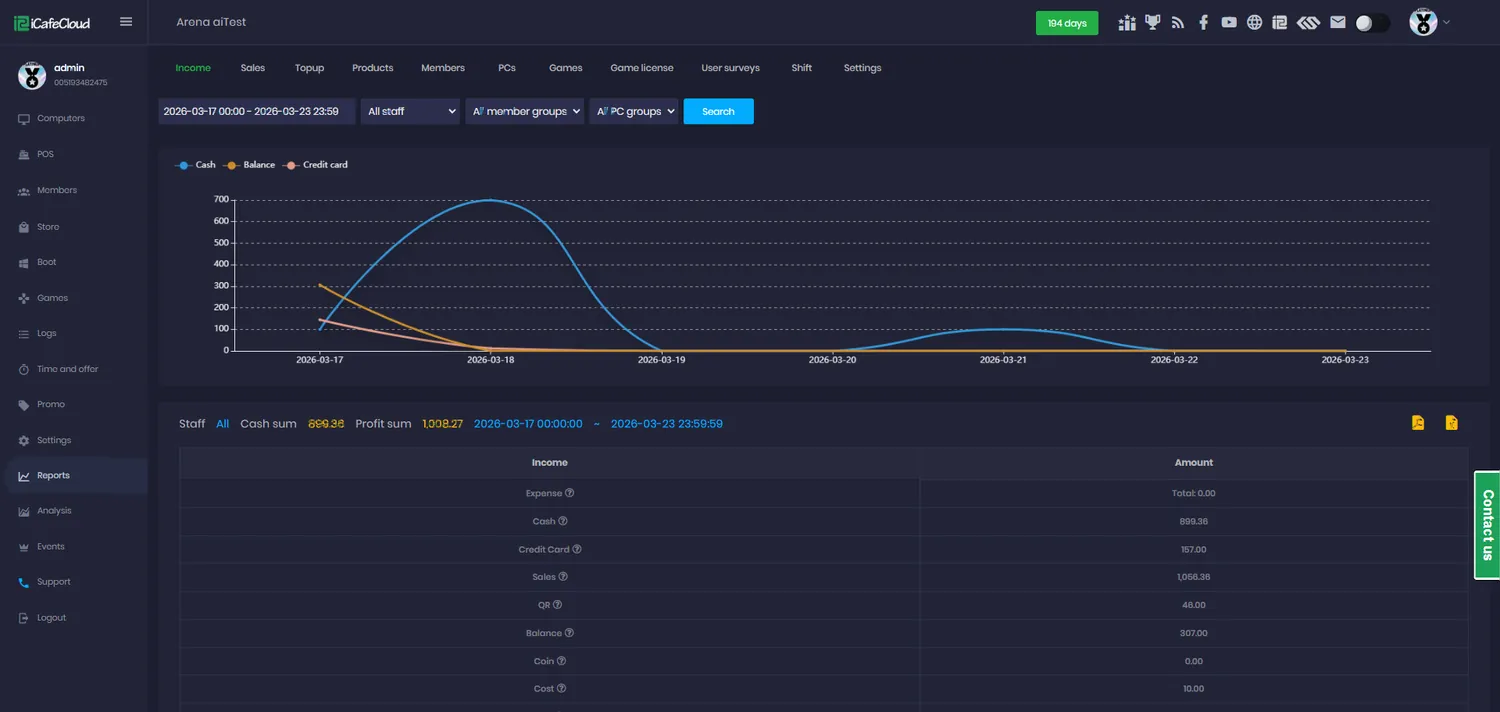
Charts are driven by the date range and the income category you pick, so the same control gives you a day, a week or a year at whatever granularity is useful.
Comparison mode overlays a second period. Seeing this month drawn against last month is what turns a report into a decision about opening hours, staffing or the price of the back row.
Getting a number you can trust
- 01
Pick the window
Presets for today, yesterday, this month and last month, or any custom range you need.
- 02
Narrow it
Filter by staff member, member group, PC group or a specific shift.
- 03
Read chart and table
Every report pairs a trend chart with a details table that shows the formula behind each figure.
- 04
Take it with you
Export shifts, transactions, top-ups, offer usage, promo codes, refunds and stock — or send reports to Google Drive on a schedule.
Documentation
Every report explained, including the formulas behind the figures.
Common questions
Can I see how a figure was calculated?
Yes. Each income report has a Details table listing the formula behind every line, so any total can be traced back to the transactions that produced it.
Can I compare one period against another?
Yes. Reports → Income → Total has a comparison dropdown for days, weeks, months and years, and the chart draws both periods together.
Can staff see each other’s numbers?
Only if you allow it. Allow access all staff data is a permission; without it an employee sees their own shift and nothing else.
Can I get the data out of iCafeCloud?
Yes. Staff shifts, attendance, transactions, top-up operations, cancelled reservations, stock, offer usage, used promo codes and refunds all export, and reports can be saved to Google Drive automatically.
Is the dashboard configurable?
Yes. Add, remove and rearrange the report and analytics cards so the first screen you open shows what matters at your venue rather than a fixed layout.
What does the PC spend report tell me?
Which machines are occupied most and which earn most, from balance and time used. It is how you find out that the back row should be repriced, moved or replaced.
The rest of the platform
- BillingPrepaid, postpaid, member and offer sessions, priced by PC group, member tier and hour of the day.
- Game LibraryOne catalogue across every PC: Steam, Epic, Riot, Uplay, VKPlay, Windows Store and your own local titles.
- Game UpdatePatches land on the server image, not on your customers. Update once, serve every machine.
- License SharingA pool of centre-owned accounts that lends a licence to whoever is playing, then takes it back.
- BookingCustomers reserve a seat from the portal or their phone; the machine is held and released for them.
- MembershipAccounts, groups, balances, bonuses and a self-service portal your regulars actually use.
- PromotionPromo codes, top-up rewards, points, bonus rules and a lucky spin — all running by themselves.
Run the venue on numbers, not on feel
Start a free trial and see a week of your own data in the dashboard.