

The following explains the data available on the Offers report and the formulas used to calculate it.
- To open it, go to Reports > Income and select the Offers sub-tab. It shows only income from time offer purchases, filtered by the selected date range, staff, member group, and PC group. (Figure 1)
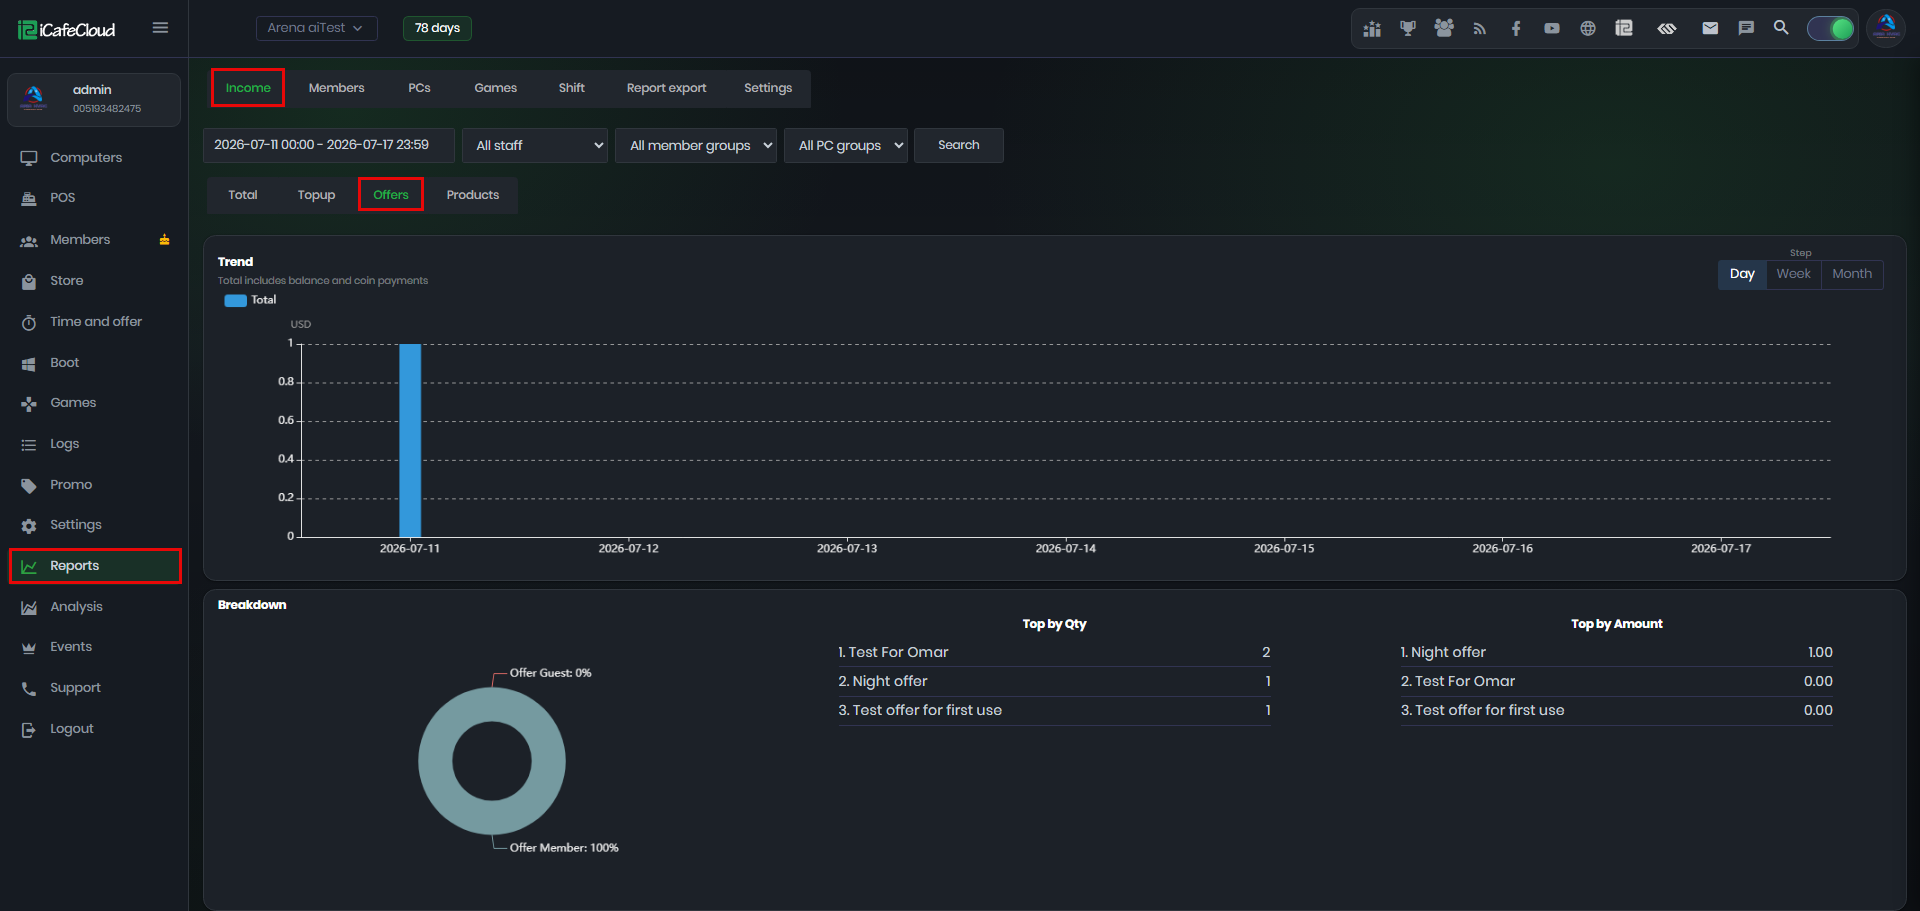
Figure 1
- Trend – Shows the total offer sales per period. Use the Step buttons (Day / Week / Month) to group the chart. (Figure 2)
Note: the Total includes balance and coin payments, so it shows the full value of offers sold regardless of how they were paid.
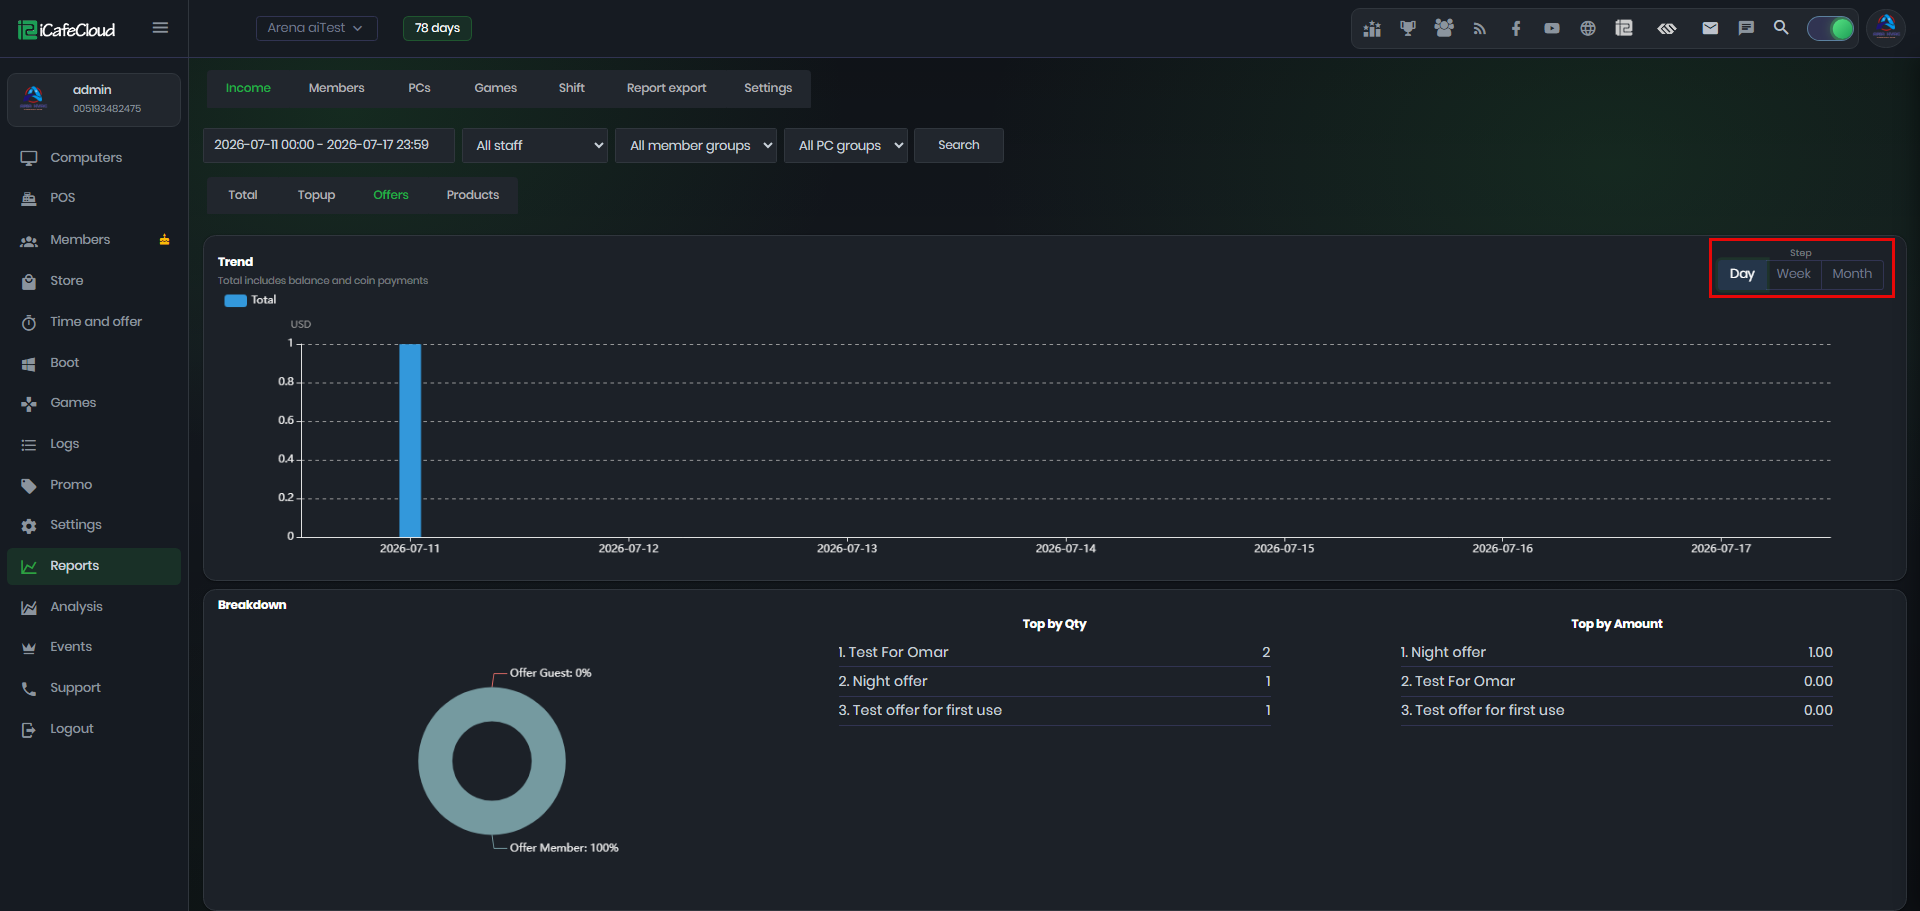
Figure 2
- Breakdown – account type: shows who purchased the offers, as a percentage of the total: (Figure 3)
Offer Member – Offers purchased by registered members.
Offer Guest – Offers purchased by guest accounts.
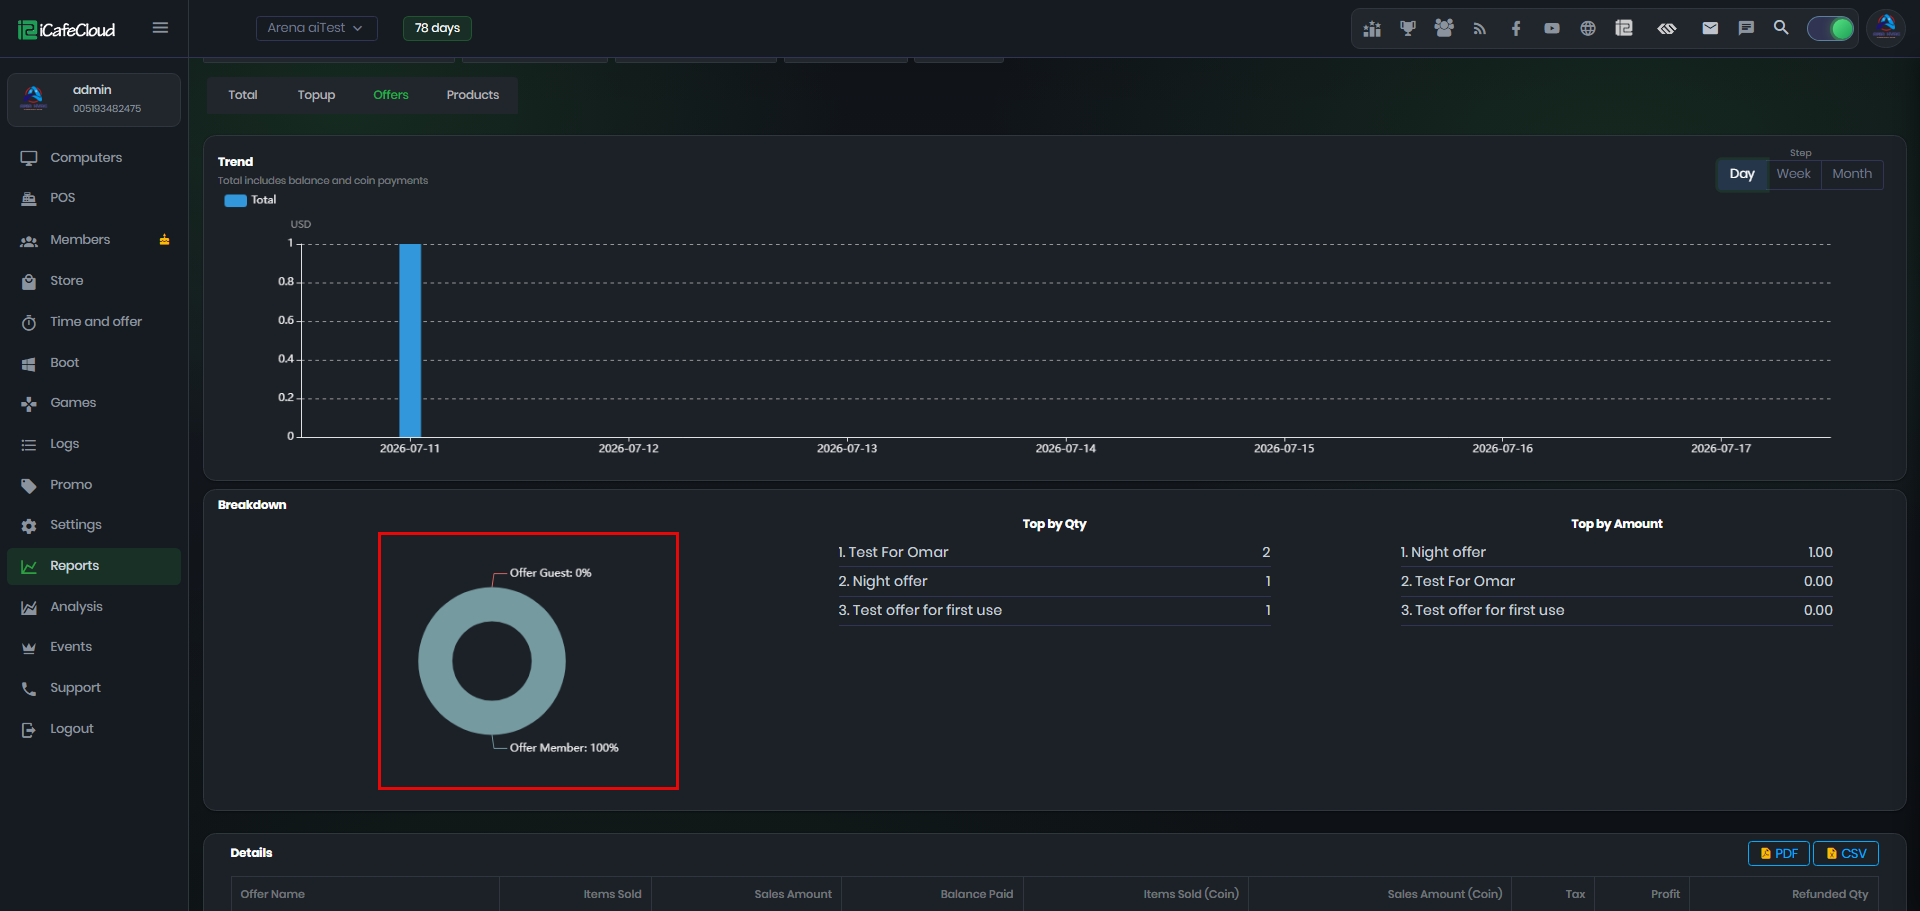
Figure 3
- Top by Qty – Ranks the offers by number of purchases in the selected period. Useful for seeing which offers are the most popular. (Figure 4)
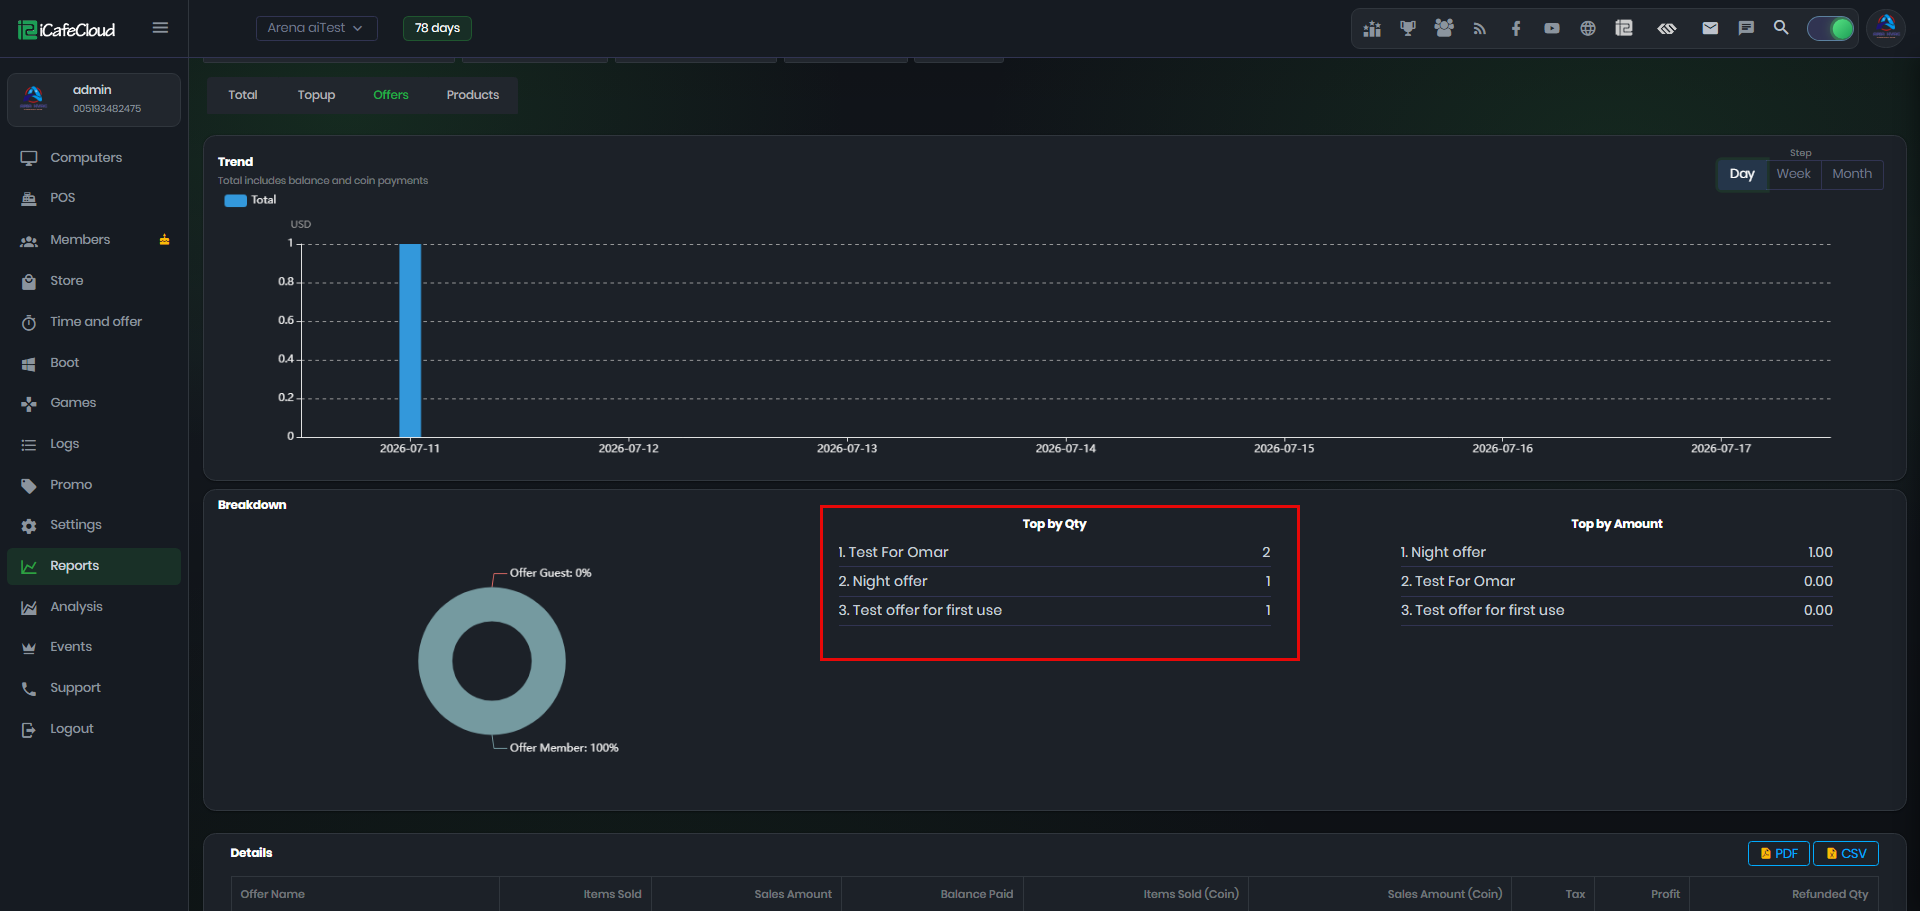
Figure 4
- Top by Amount – Ranks the offers by sales amount. An offer can rank high by quantity but low by amount if it is cheap or paid with balance, so the two lists can differ. (Figure 5)
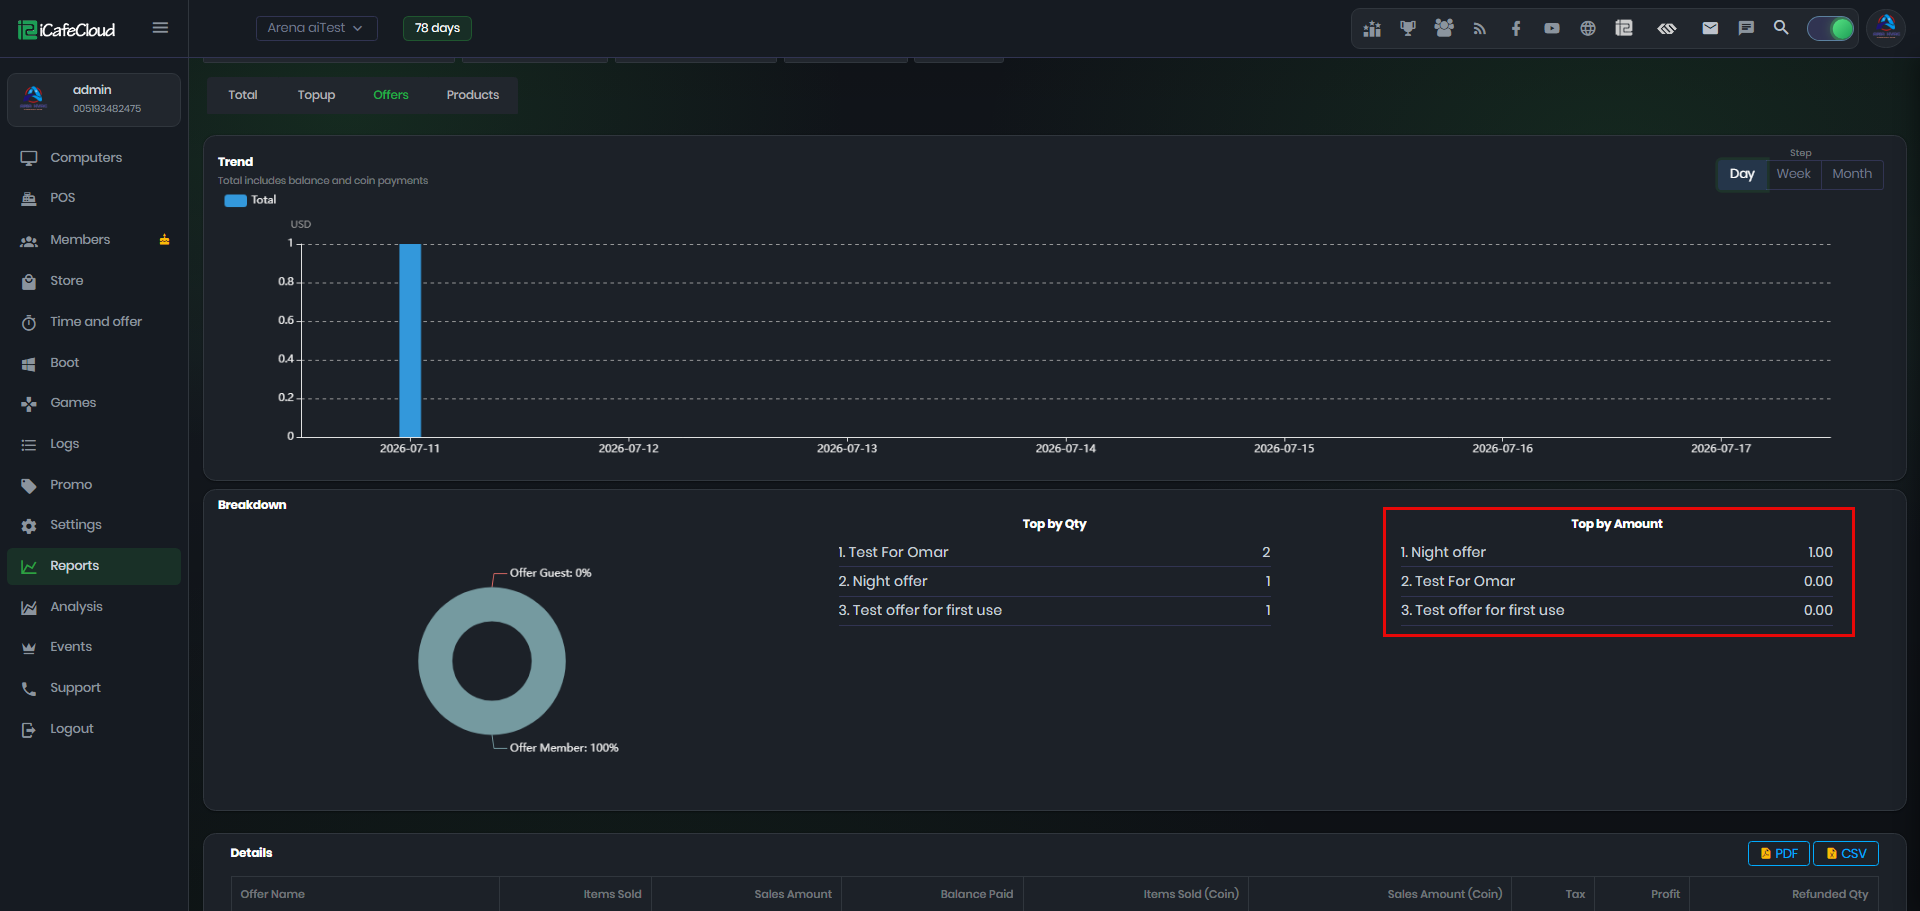
Figure 5
- Details – The table at the bottom lists every offer sold in the period, with PDF and CSV export buttons: (Figure 6)
- Items Sold = Number of times the offer was purchased.
- Sales Amount = Income from the offer paid with money.
- Balance Paid = Amount paid using member balance.
- Items Sold (Coin) / Sales Amount (Coin) = Purchases paid with coins and their value.
- Tax = Tax collected on the offer sales.
- Profit = Sales Amount − Tax (offers have no product cost).
- Refunded Qty = Number of refunded offer purchases.
- The Total row sums each column for all offers.
Ex: In Figure 3, Night offer sold once for 1.00 with 0.09 tax, so Profit = 1.00 − 0.09 = 0.91.
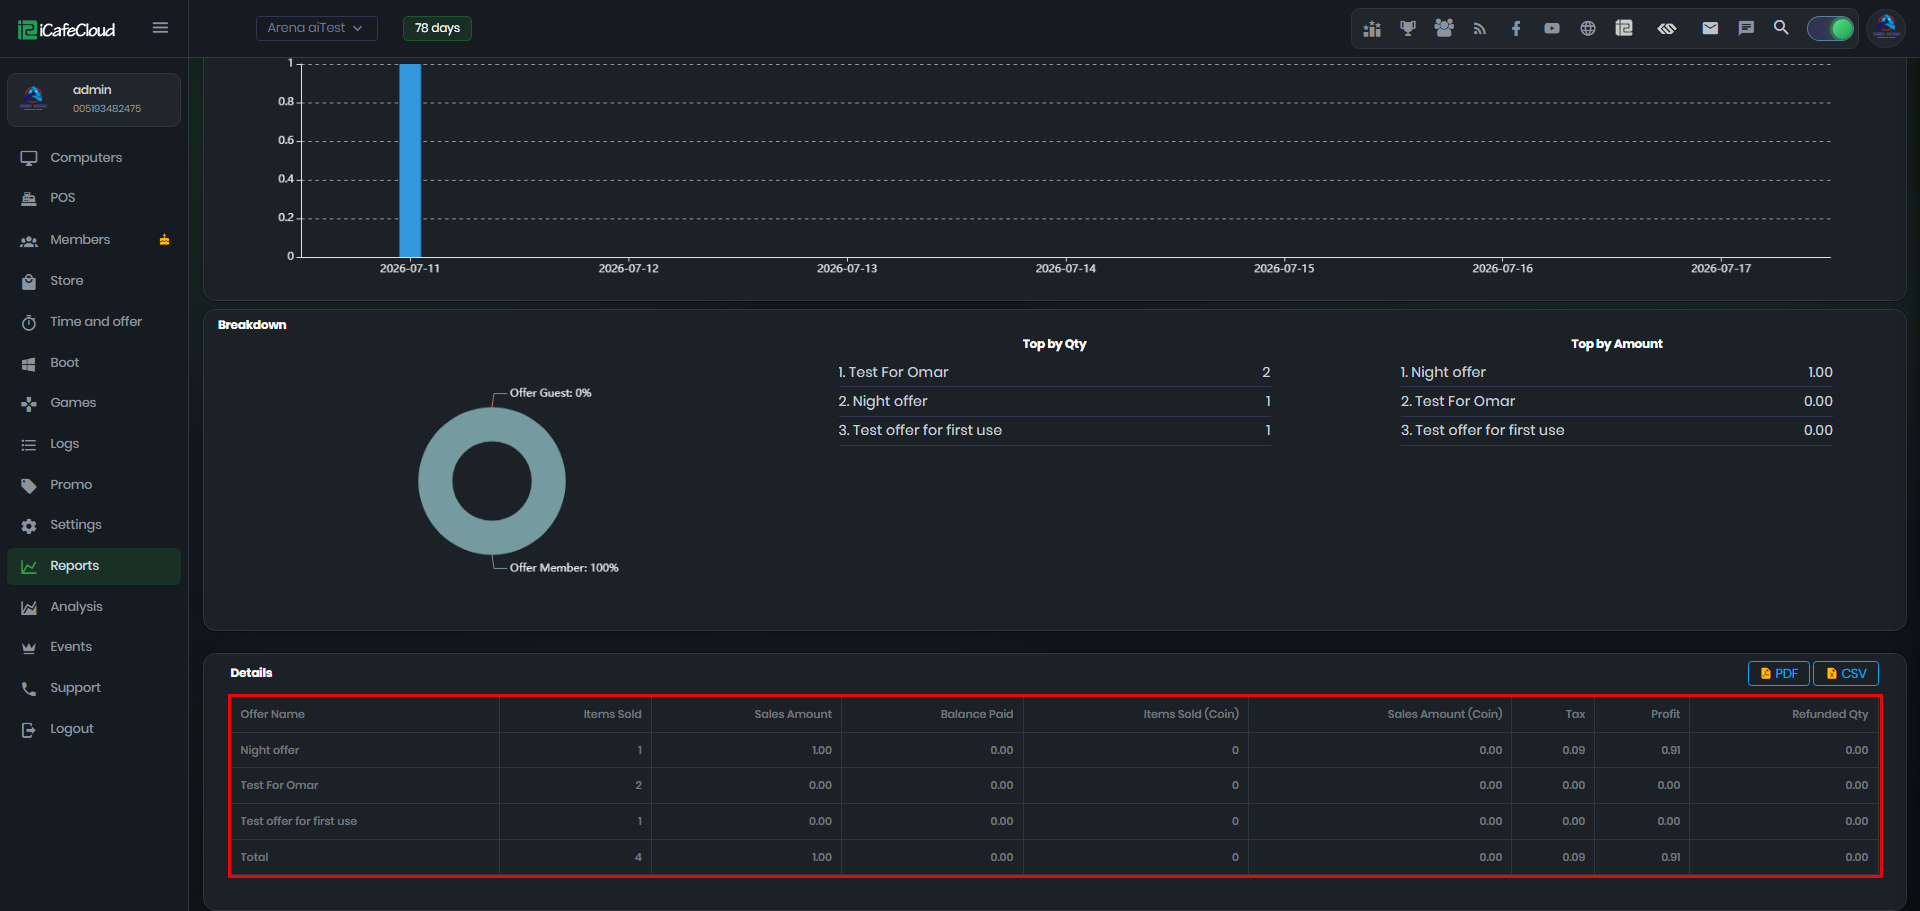
Figure 6